


Obliterating Peak Oil Demand: OPEC WOO vs IEA WEO & NZ0
Obliterating Peak Oil Demand

This week we return to a long-standing theme of ours but one we haven’t discussed in over a year: “obliterating peak oil demand.” The motivation is OPEC’s recently published World Oil Outlook 2050 report (link), which paints an optimistic view of long-term oil demand. OPEC Research stands in stark contrast to the “oil demand is on the verge of peaking” viewpoint seen in the IEA’s World Energy Outlook (link) and its Net Zero by 2050 (link) reports as well as in the forecasts of many other notable energy voices. OPEC’s view of rising living standards and energy needs is consistent with our own. The difference between the more optimistic view of long-term oil demand that we and OPEC have versus the consensus view that oil is on the verge of being a sunset industry is at the heart of the long-term investment opportunity we see in the traditional energy sector.
The core of our view is that given the massive unmet energy needs of the other 7 billion people on Earth, we are highly skeptical that oil demand is on-track to permanently peak by 2030. We believe the peak oil demand view is wrong on three main counts:
Over-estimating an acceleration in fuel economy and other efficiency gains (globally) by not accounting properly for increasing vehicle weight and consumer preferences.
Aggressively forecasting an “s-curve” adoption of electric vehicles (EVs) in all major areas of the world (Norway and China have had more success on this front).
Effectively assuming that vast swaths of humanity will remain poor into perpetuity—a repulsive implicit assumption, in our view.
The driver of what we view as faulty assumptions has been the willingness by those same groups to believe that humanity would suddenly invert its energy hierarchy of needs by prioritizing carbon emission reductions over all other objectives. This was especially true during the 2020-2023 peak of “energy transition and urgent climate crisis” narratives. We never thought that view made sense despite gaining a fair amount of popularity. We created Super-Spiked in part to push back on that framing. While that narrow “The Energy Transition” worldview is fading, there is still a lingering debate on the long-term health of global oil demand.
If we are to offer some grace to those calling for peak oil demand, it resides in some of the variables that have kept us in “Super Vol” not super-cycle mode for oil prices:
Global GDP growth has been sluggish in recent years.
China’s oil demand growth rate is slowing sharply driven by demographic challenges (declining population), trade tensions and other challenges to China remaining “factory of the world” (which is highly energy intensive), and the significant ramp in non-oil based vehicles (EVs and LNG trucks) in the country; we agree that the best days of China oil demand growth may be in the past and that a possible long-term plateau is a headwind for oil markets this decade.
Near-term substitution out of using oil in power generation in places like Saudi Arabia.
The last point (Saudi oil power substitution) is clearly one-off in nature, similar to what we saw in the OECD in the 1980s following the 1970s oil crises. In the case of China’s oil demand slowing, we agree with that view. But we have yet to see a single forecast from any oil observer that models everyone on Earth some day becoming energy rich and enjoying the lifestyles The Lucky 1 Billion of Us take for granted. Some will say that is not possible. Perhaps not in the current decade or even the next one. But no one on Earth aspires to stay poor. Everyone wants and deserves to be energy rich.
A word on the IEA
Before diving in further, we want to clarify our views on both the International Energy Agency (IEA) and OPEC Research. We have subscribed to the IEA’s flagship monthly Oil Market Report (OMR) for our entire career. We can still remember using it to create our first oil supply/demand model back in the early 1990s. The IEA’s OMR has long been the gold standard of near-term oil supply/demand forecasting and the one that sets the tone for market expectations.
As a result, it has also at times come under withering criticism for being supposedly biased or inaccurate in one direction or another. The so-called “missing barrels” issue has long been a point of punchlines and pushback toward the IEA. Missing barrels refers to the occasions when the difference in supply and demand do not correspond to changes in oil inventories (a simple ChatGPT search can provide a fuller explanation for those interested).
Here is where we stand on the IEA:
Its forecasts are made in good faith. You can disagree with its conclusions or perceive political bias in its leanings. But our first-hand interaction with IEA personnel has been that they are super smart, dedicated to their profession, and act in good faith.
No one is forced to adopt their conclusions. Every person and every leader in all companies and countries have the opportunity to think for themselves and arrive at their own conclusions about where oil markets are headed. We would recommend incorporating the IEA’s high quality historic data in doing so.
The fact that the IEA often faces intense criticism is a sign of their stature and historic success as an organization. This is something we experienced during our career at Goldman Sachs, both towards us specifically and the firm broadly.
To be clear, we strongly disagree with the framing and conclusions of IEA’s Net Zero by 2050 report series. But if that is a perspective IEA leadership felt was important to publish, so be it. If you took it literally or changed your company’s or country’s policies to align with its messages, that is on you. It is up to those that disagreed with its messages to publicly and privately advocate otherwise. It was a contributing factor to our creating Super-Spiked and un-retiring to Veriten. In June 2021, Saudi Energy Minister Prince Abdulaziz bin Salman was famously quoted as saying “I would have to express my view that I believe it is a sequel of [the] La La Land movie. Why should I take it seriously?” Good job by the Saudi minister for leaving no doubt on where he stood.
A Word on OPEC Research
In many respects, OPEC Research faces the opposite issue of the IEA, especially from those that do not closely follow oil markets: a lack of respect as an objective voice given it is part of OPEC. Admittedly, we too have only started looking regularly at OPEC’s also excellent Monthly Oil Market Report (MOMR) since we started publishing Super-Spiked. It is also only within this recent period that we have become acquainted with OPEC Research personnel and attended various meetings at their Vienna headquarters. Like the IEA, we believe OPEC Research makes its forecasts in good faith and has a similarly high quality group of outstanding researchers that are doing their best to assess oil and energy market conditions.
While we could debate whether a brand name change would help the perception of objectivity from OPEC Research, OPEC itself has evolved considerably from when it found its footing in the 1970s (it was officially created in 1960 but rose to prominence during the oil embargo years in the 1970s). OPEC today is much more of an institution that represents non-Western interests than it is a price-setting “cartel” as popularly depicted in western media. As we were recently reminded in Vienna earlier this year, the “C” in OPEC stands for countries, not cartel, with the latter term associated with illicit drug gangs south of the U.S. border. From that same gathering, we were told that the “C” is also indicative of “cohesion” and “co-operation” to ensure smoothly functioning oil markets to ensure adequate supply exists to meet global oil demand at reasonable prices.
It is our view that the developing world could use its own institutions that represents its interests, especially at a time that many western institutions are in need of major reform. This point was echoed in the WOO report:
Outside of the existing structure, new institutions are emerging in parallel to the existing Western-led landscape. For example, the expansion of BRICS to include growing economies such as the UAE, IR Iran, Indonesia, Ethiopia and Egypt provides a framework for cooperation and coordination beyond the existing structures. The establishment of the New Development Bank institutionalizes the largely informal grouping to further enhance formalized cooperation. Regional trade blocs are also expanding, encompassing larger parts of regional economies. The Regional Cooperation Economic Partnership in Asia and the African Continental Free Trade Area are pushing this cooperation further. Furthermore, direct relationships between blocs are also increasing. This includes the long-negotiated EU-Mercosur partnership that is in its final stages, with further trade deals directly between blocs likely to continue to rise.
The shift will not dismantle global institutions or tip the global economy into a complete fracturing and disarray. Rather, the shift is set to restructure the role of existing institutions for cooperation and dialogue, and in parallel, see new institutional arrangements and direct relationships dominate the global economy. This allows major advanced and emerging economies alike to adopt industrial policies that are more strategically oriented to meet their policy goals, rather than be subject to pure global market forces.
We couldn’t agree more.
OPEC WOO vs IEA WEO & NZ0 by 2050
A Big Divergence In Long-Term Oil Demand Expectations
Exhibit 1 shows the significant divergence in long-term oil demand projections between the OPEC WOO, IEA WEO, and IEA NZ0 reports. In our view, over 2021-2023, most market participants viewed a flattish long-term oil demand outlook as the base case with risk skewed in the direction of various net zero scenarios, though few we think believed the specific collapse scenario provided in IEA NZ0. We believe market sentiment is shifting toward viewing modest continued growth through the early 2030s followed by a long-term plateau as the base-case and is placing far less weight on the downside NZ0 scenarios. Still, the market, broadly speaking, is not yet embracing the more optimistic forecasts that OPEC and we have.
Exhibit 1: Over-under on long-term oil demand scenarios is quite wide!
Source: IEA, OPEC, Veriten.
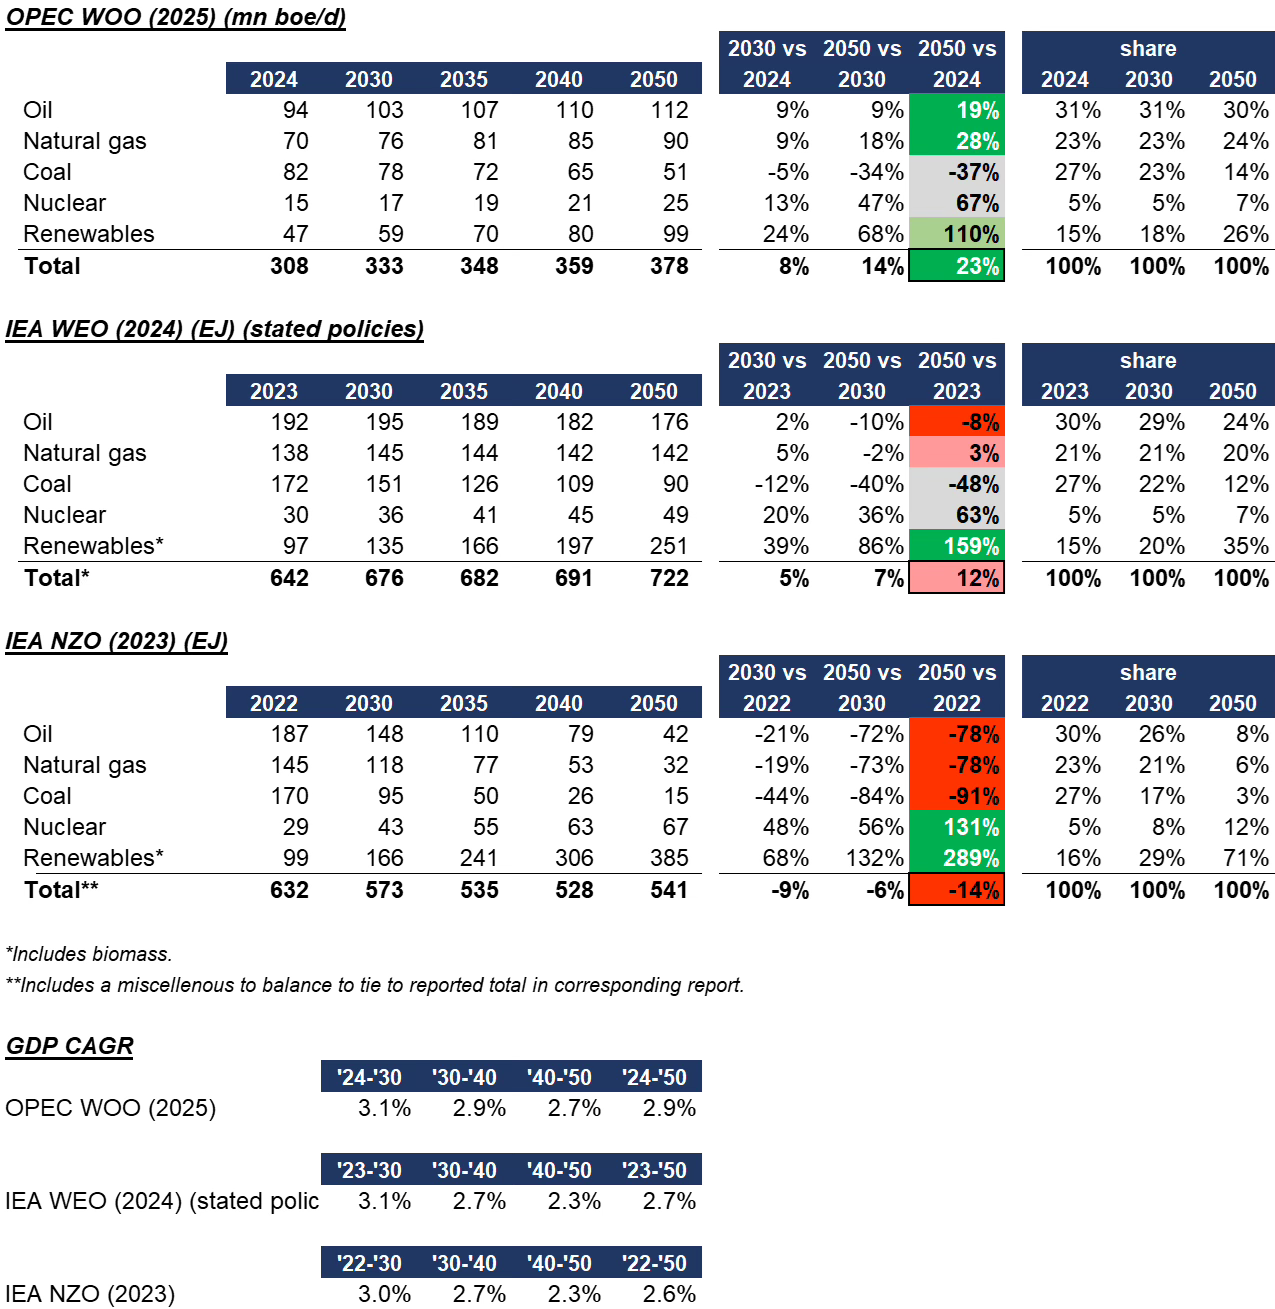
Exhibit 2 provides some details on the specific scenarios for future energy supply by energy source from OPEC and the IEA via the reports being discussed.
A few points to clarify:
We are using the “stated policies” scenario for the IEA WEO as something closest to the “reference case” used by OPEC.
OPEC uses millions of barrels of oil equivalent per day as its metric of choice, whereas the IEA uses exajoules.
We have done our best to be consistent on energy source categories between the various reports; we do not believe any category differences are meaningful to the conclusion we are drawing in this post.
Points of agreement or only modest disagreement between OPEC WOO and IEA WEO include the following:
Both reports assume a significant decline in coal usage post 2030 and a significant rise in nuclear power (we use a grey shading to note the similarities in Exhibit 2).
Both reports assume significant growth in renewables, though the IEA is above OPEC in the speed and level of ultimate growth by 2050.
OPEC assumes slightly faster GDP growth until 2050, which would naturally lead to higher energy usage.
The biggest points of disagreement between OPEC WOO and IEA WEO is of course in the higher growth rates OPEC has for both oil and natural gas. As for the IEA’s Net Zero report, all traditional energy sources fall off a cliff quickly, while renewables grow substantially. Overall energy usage is lower, though this is driven in large part by the “electrify everything” assumption that would correspond to lower primary energy usage (less energy loss from non-combustion technologies). We note that the GDP assumptions between IEA WEO and NZ0 are essentially the same (year of publication differed so there are some minor differences).
Exhibit 2: Scenario comparison details for OPEC WOO, IEA WEO & NZO reports
Source: IEA, OPEC, Veriten.
We believe there are three main areas, which we discuss further below, that account for OPEC’s higher oil demand scenario versus the IEA (both WEO and NZ0):
A recognition that peak China does not mean peak oil demand, as demand growth shifts to India, other Asia, Africa, the Middle East, and Latin America.
The base effect on oil demand of the existing ICE (internal combustion engine) vehicle fleet both globally and in a China plus a more subdued ramp in the overall share of EVs (electric vehicles) globally.
A recognition that efficiency gains are happening, but not at an accelerating pace.
Primary energy growth shifts to Rest of World ex-OECD, China
The fact that OECD demand is mature and China is maturing is a major source of underlying pessimism many oil market observers have about the long-term outlook. This is a view we and OPEC largely share, though we would note OPEC assumes OECD oil demand stays flat rather than declines as most other observes assume. Most importantly, OPEC highlights significant growth in India, Other Asia, the Middle East, Africa, and Latin America (Exhibits 3 and 4). The comment that India alone will not rise as quickly as China is a point we agree with. It is the inclusion of the Rest of the World that causes us to remain more optimistic on long-term oil demand, consistent with OPEC Research.
While many recognize that India and Other Asia (excluding China) are likely to grow, we want to give a special shout out to Africa, which for the first time in our 33 year career, looks like it may finally be ready for better energy and oil demand growth. We note that higher African oil demand was a source of a meaningful upward revision to historic IEA oil demand figures in recent months. It is a continent worth watching.
Exhibit 3: Primary energy growth shifts to Rest of World ex-OECD, China
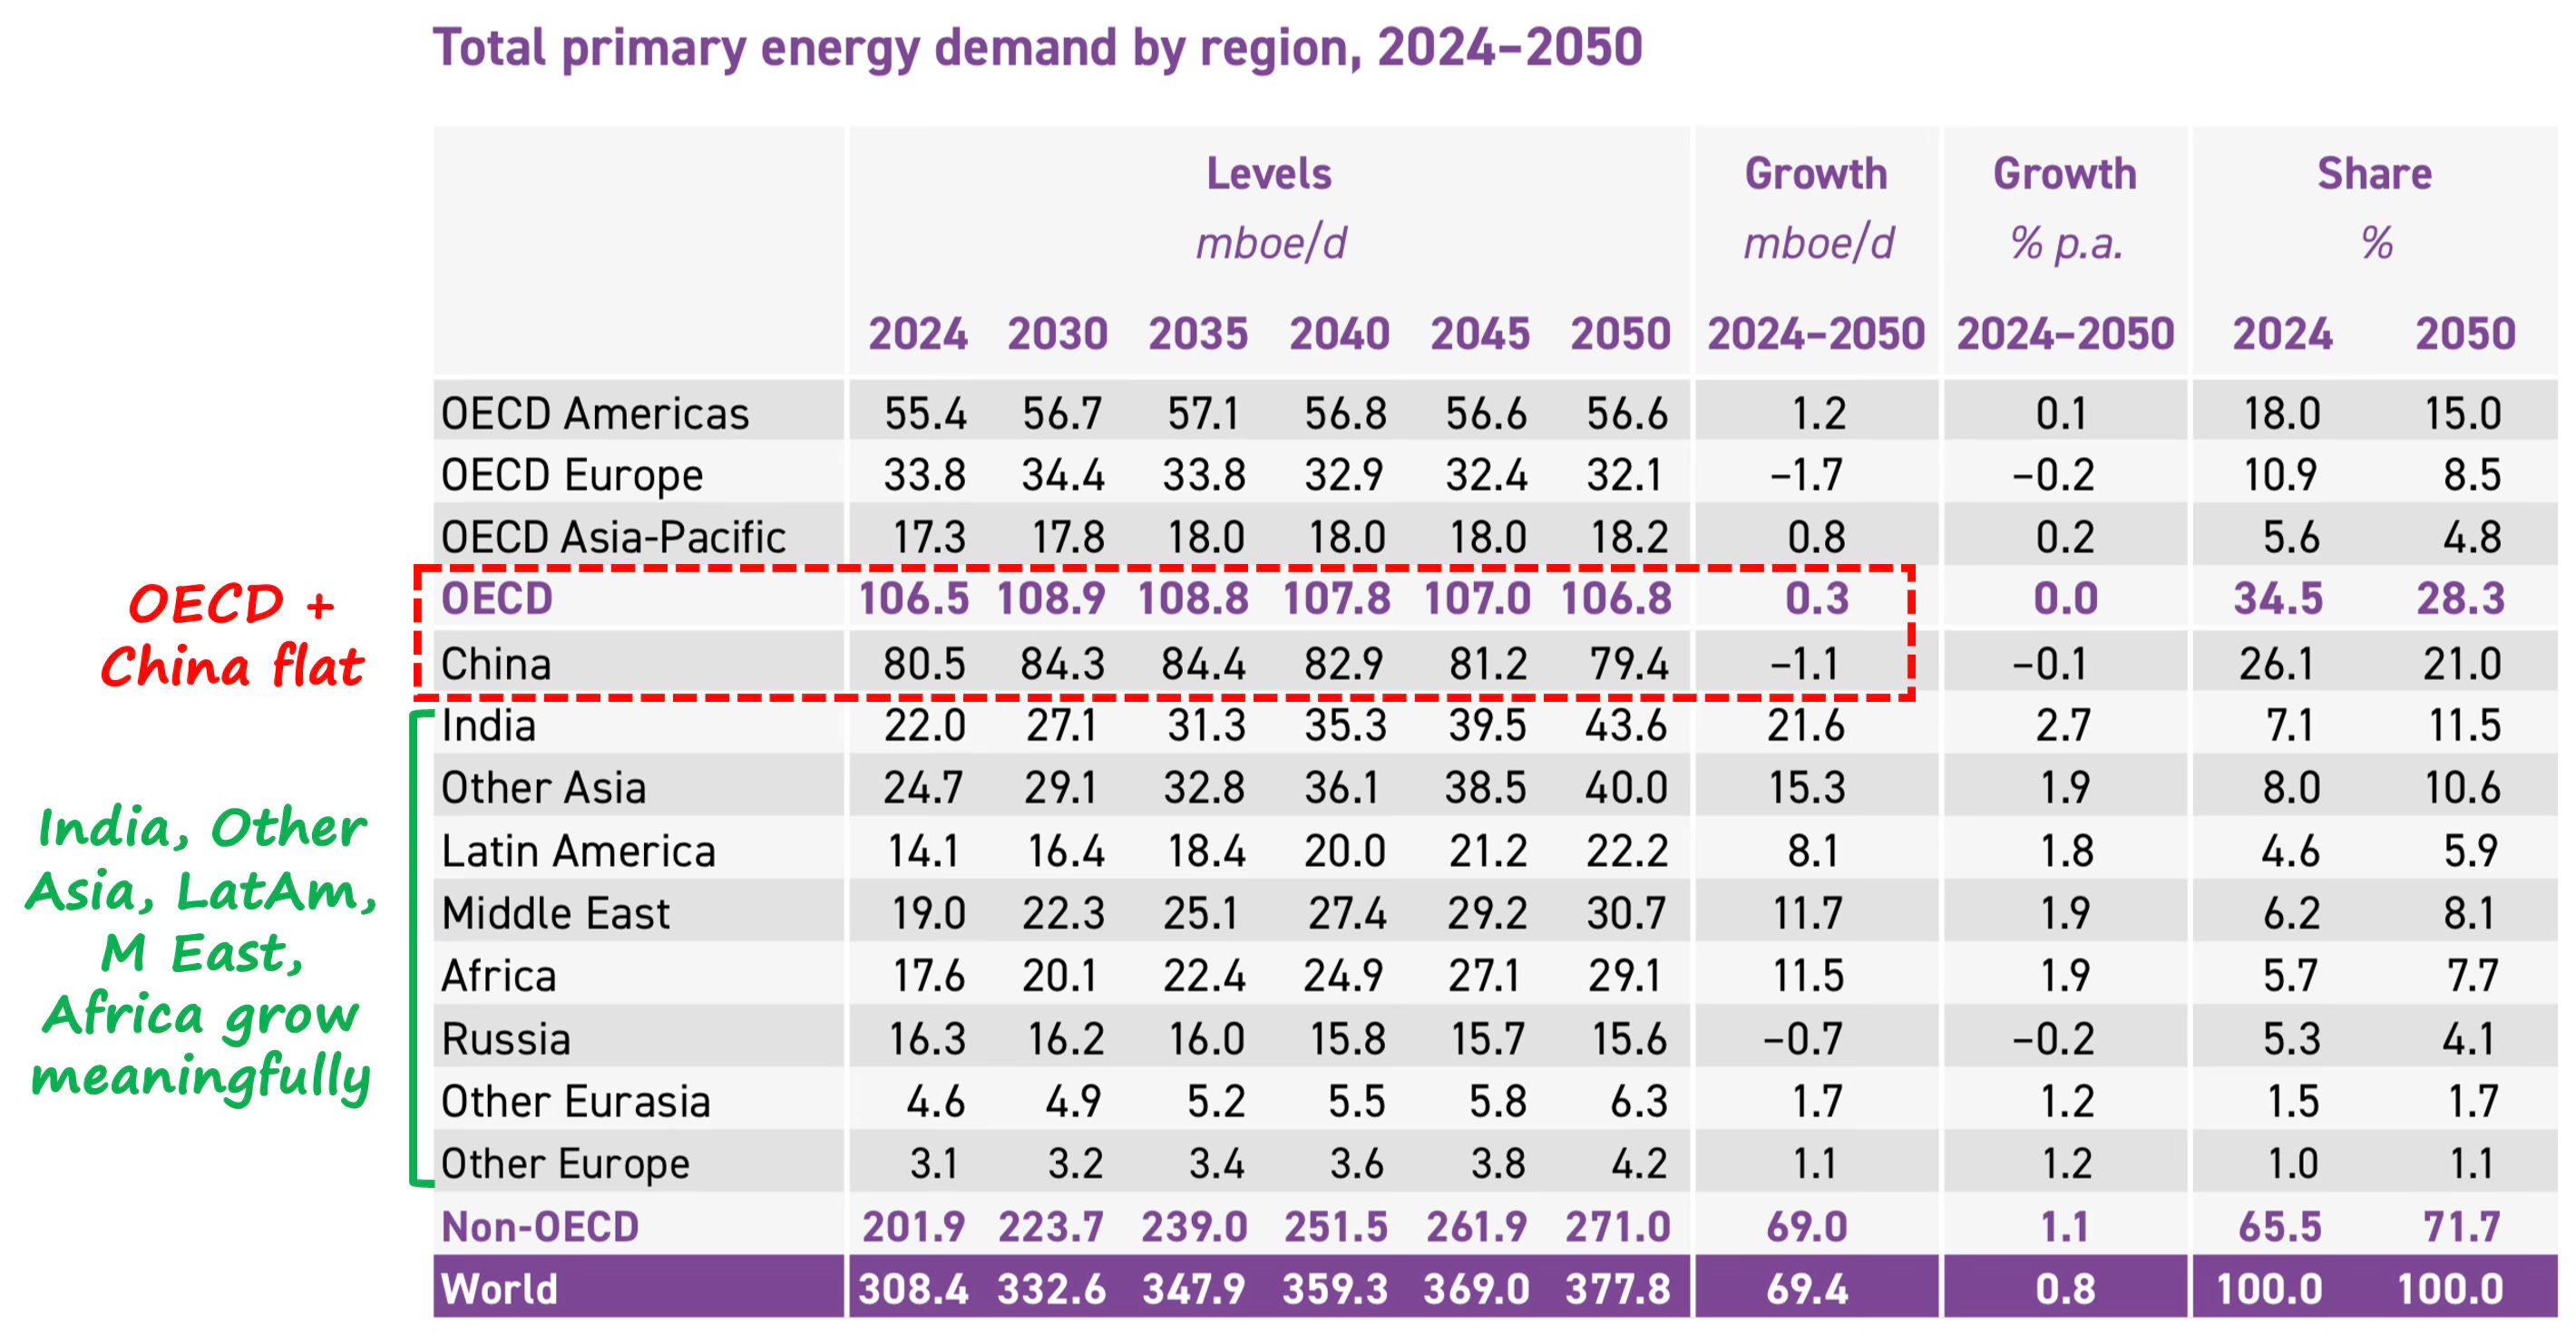
Source: OPEC, Veriten.
Exhibit 4: Future oil demand growth similarly shifts to a number of developing areas from China
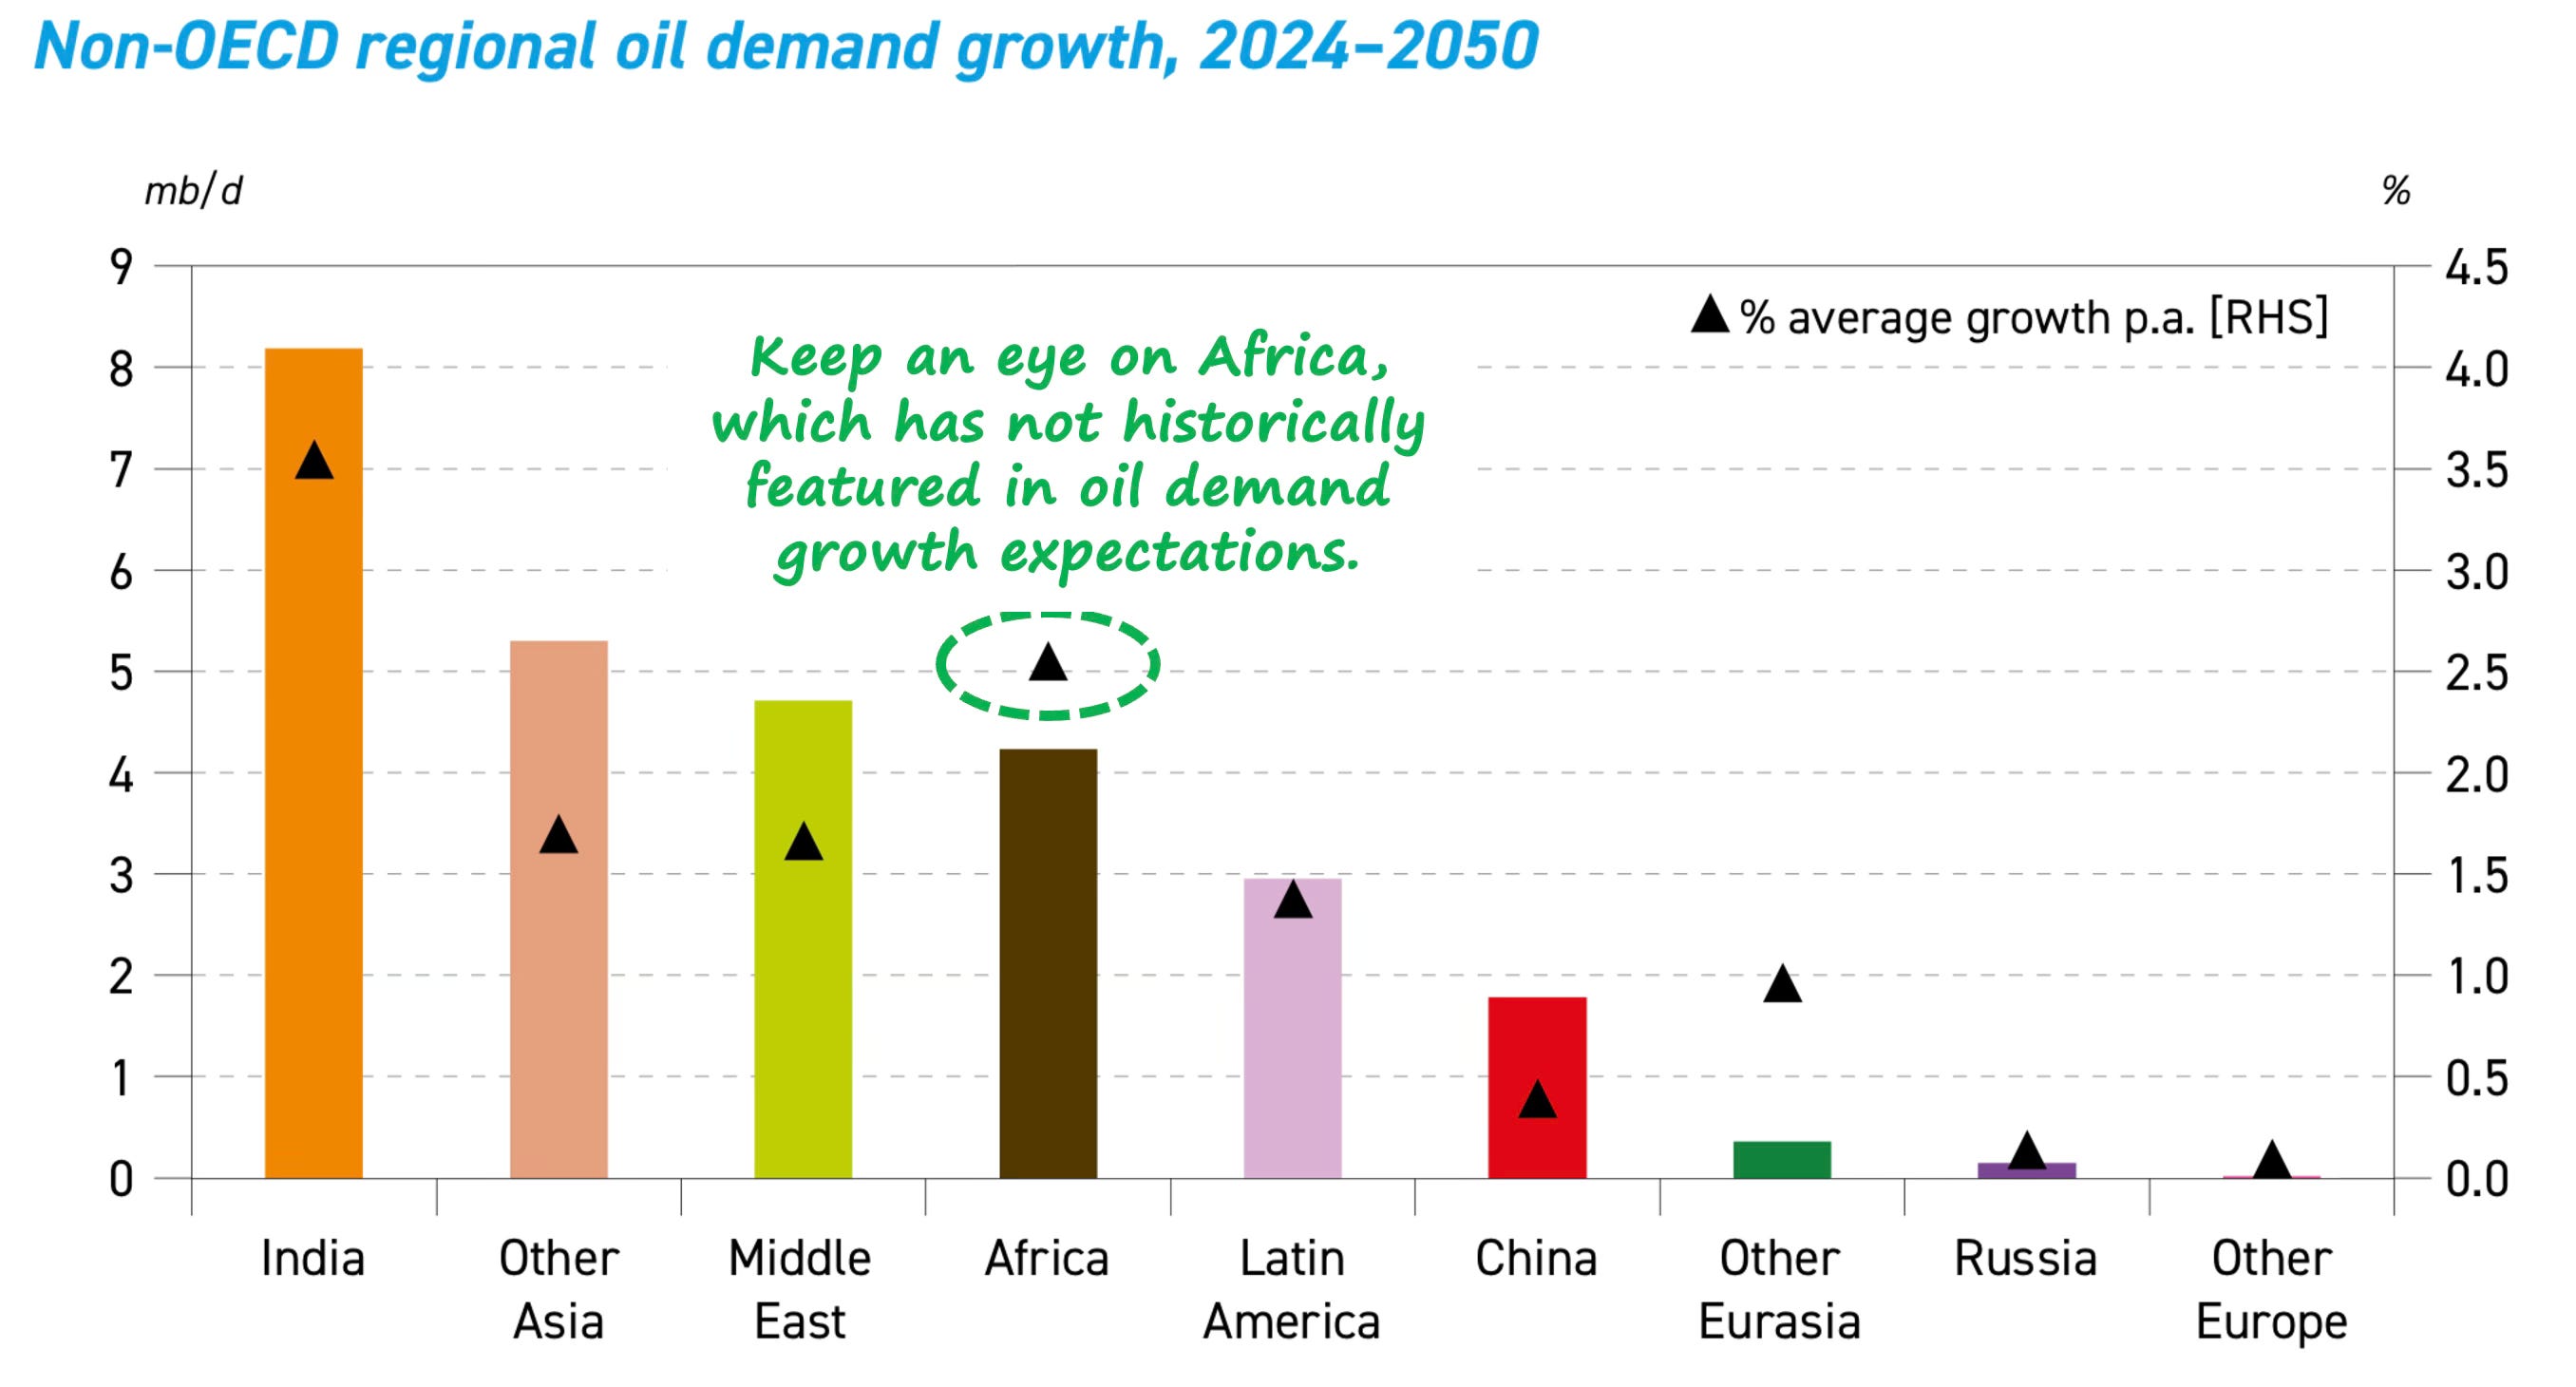
Source: OPEC, Veriten.
Total car park grows, but ICE still dominates
There are two related points as it relates to the rise of EV sales that the OPEC report does a great job illustrating (Exhibits 5 and 6). First is the sizable installed based of ICE vehicles, which provides a floor to road transportation demand that we suspect is missing in many more bearish views. This can be seen both globally and in China. The second point, which we have long agreed with, is that EVs will be an attractive option for a portion of the market but will come nowhere near the “100% of global sales” ubiquity by 2040-2050 that was touted by net zero ideologues just a few years ago.
Exhibit 5: Total car park grows, but ICE still dominates
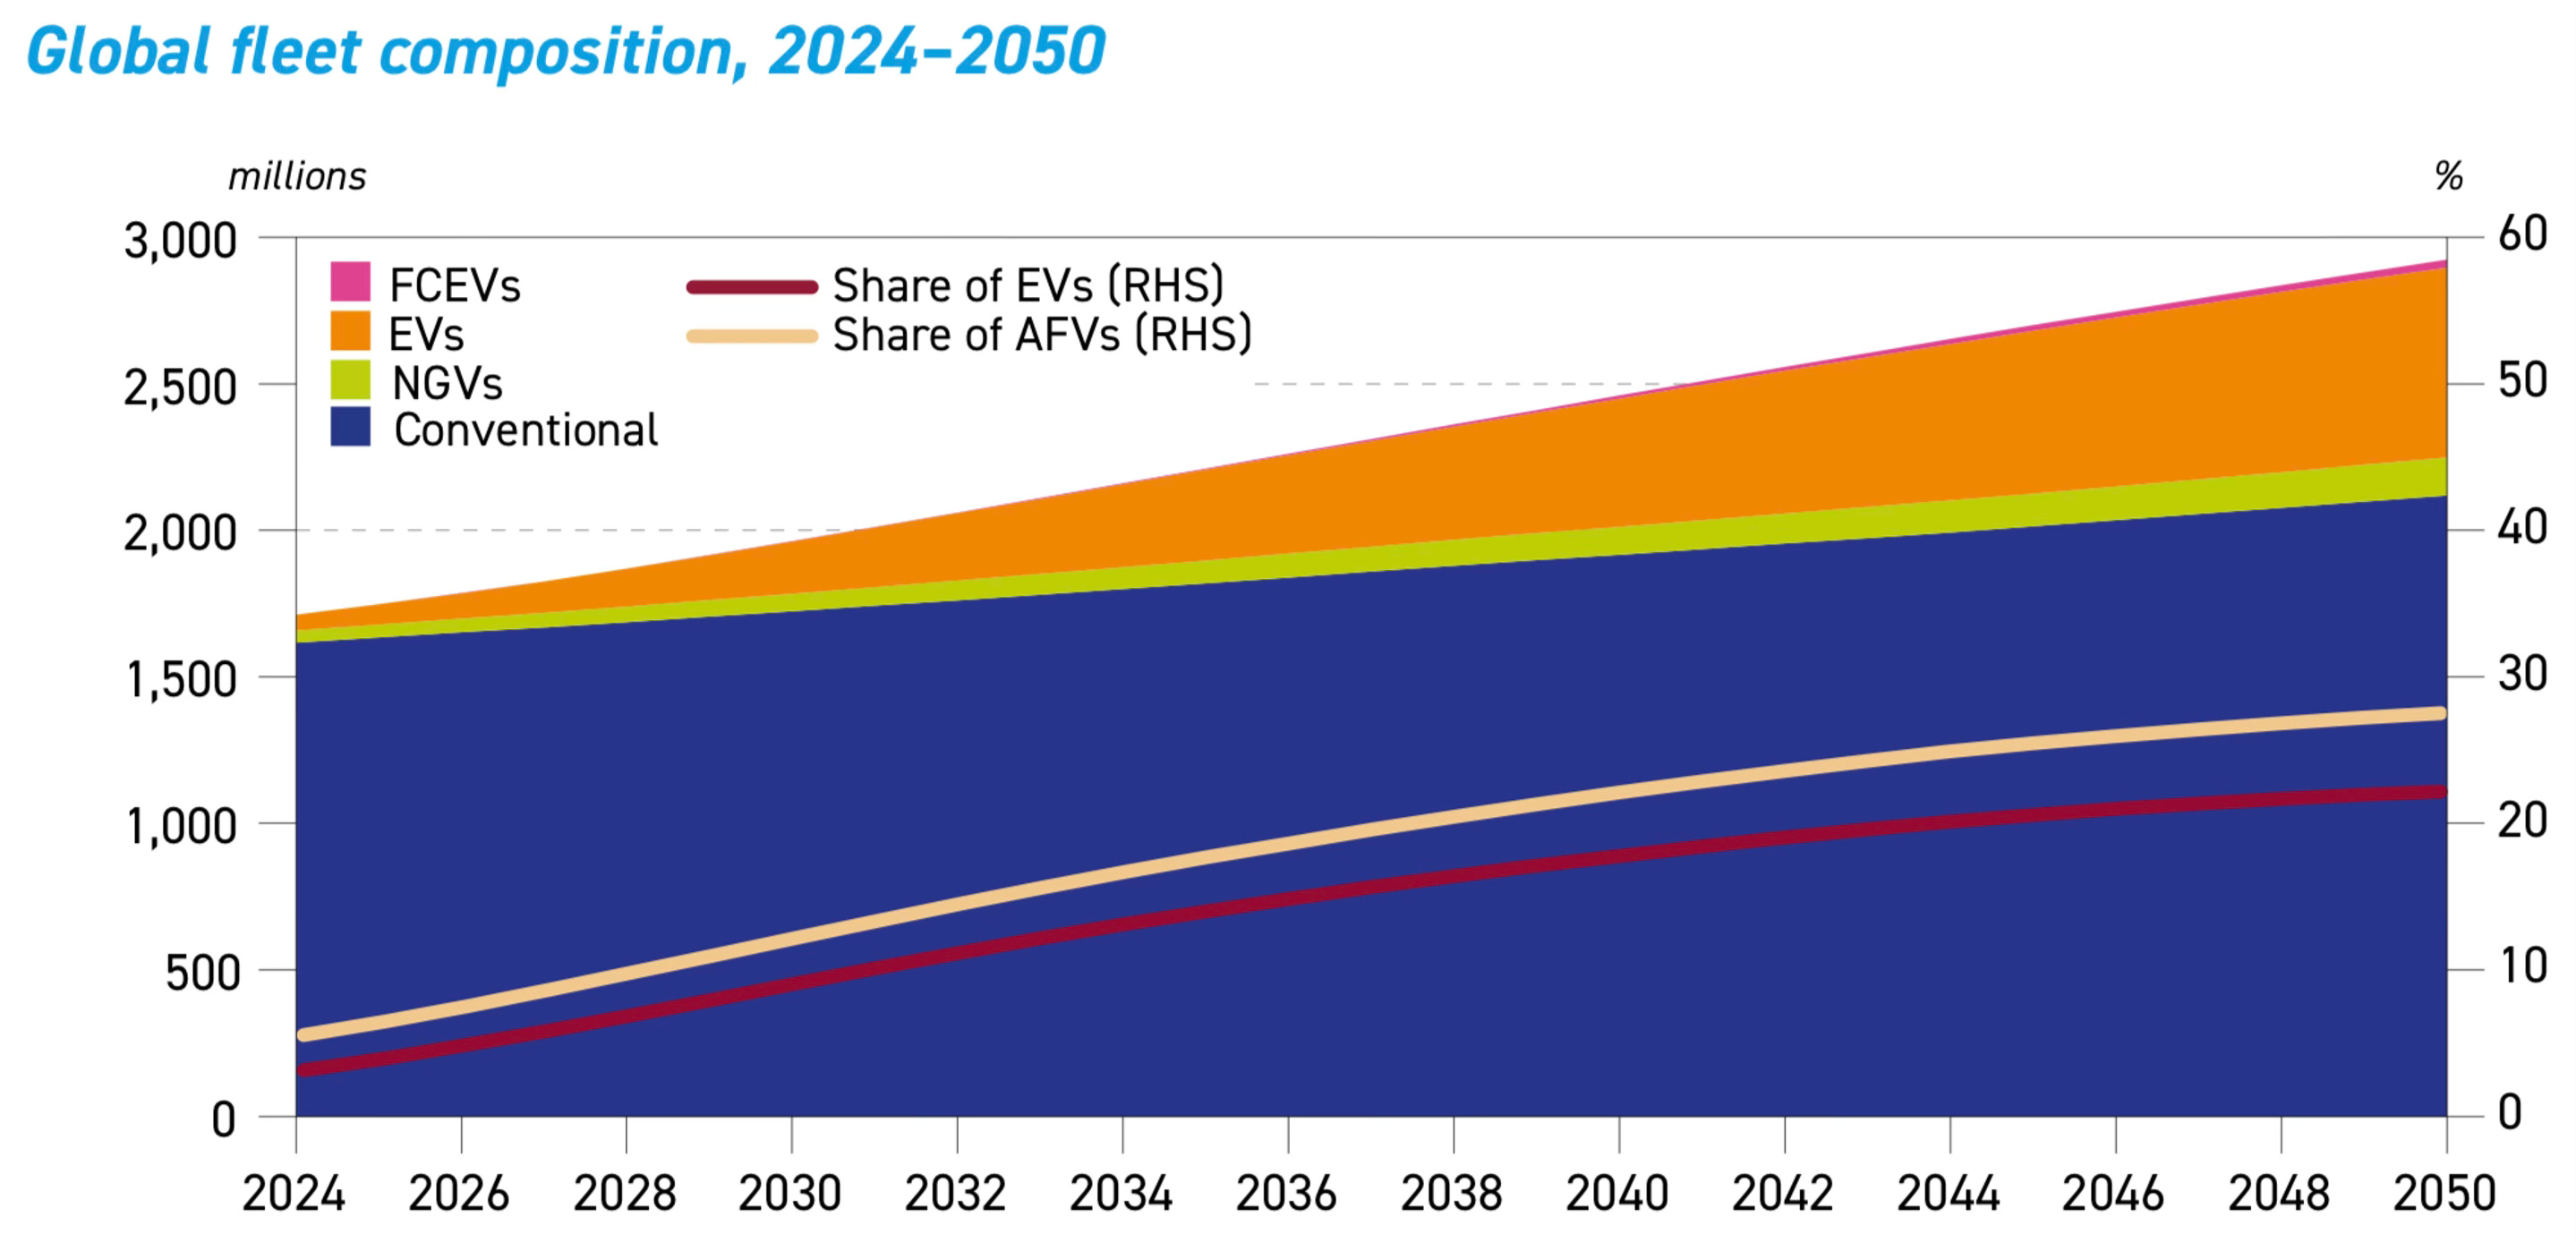
Source: OPEC.
Exhibit 6:China ICE base effect, despite fast EV growth
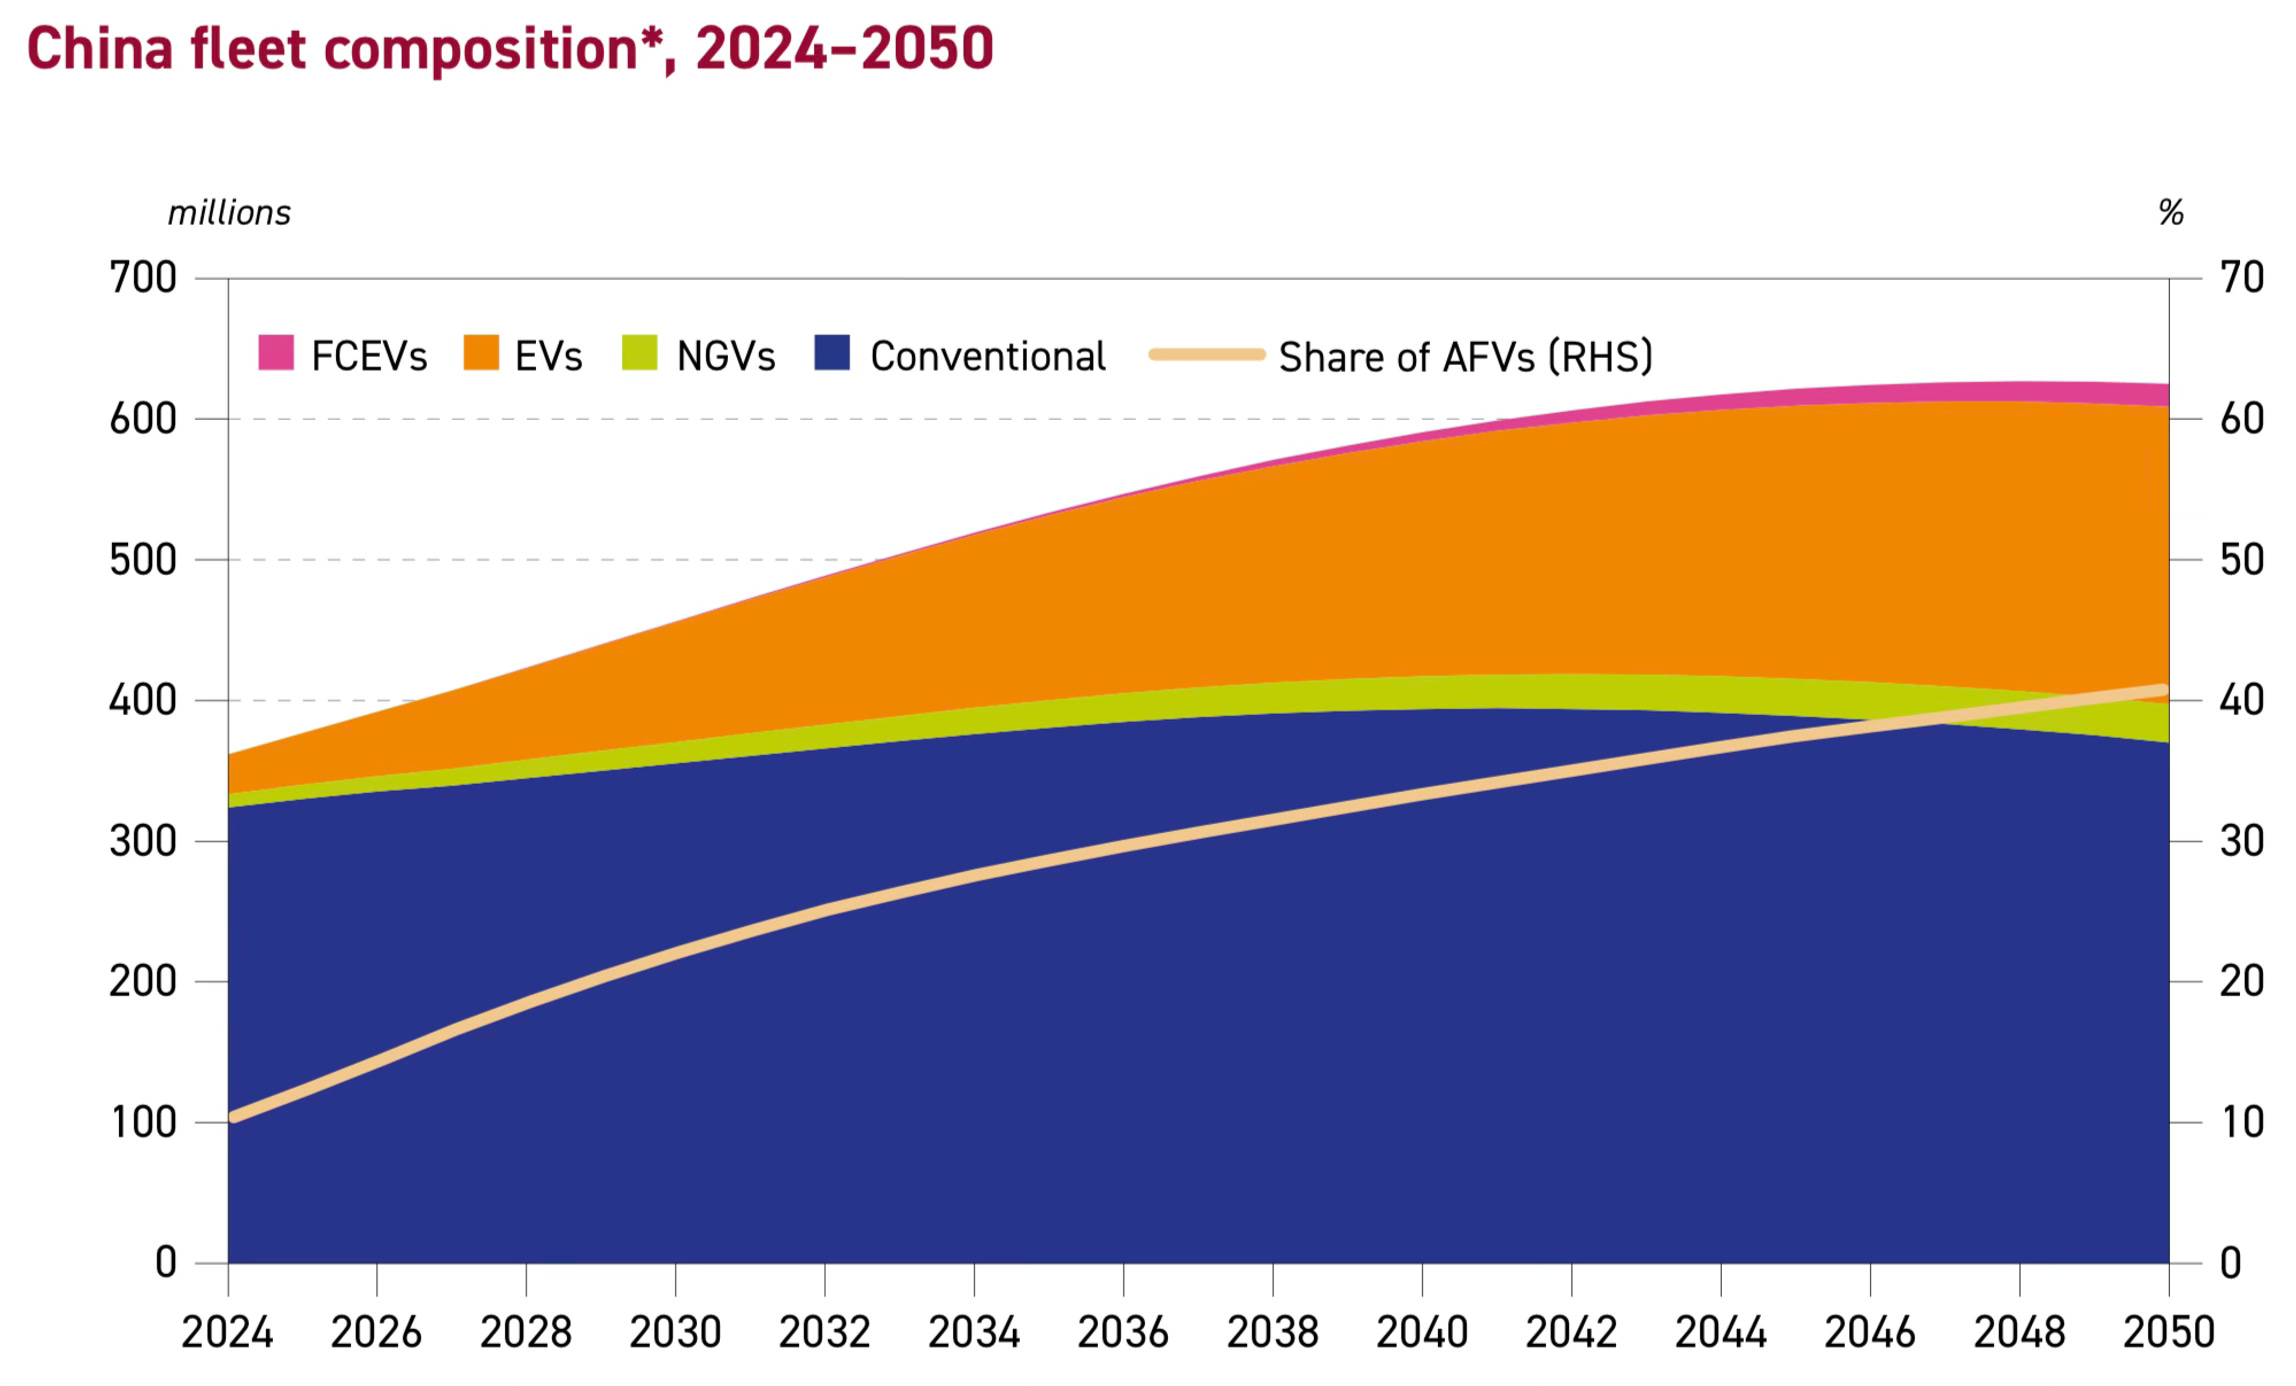
Source: OPEC.
Efficiency gains steady not accelerating
The final point OPEC illustrates is something we have long discussed including during our Goldman Sachs days: the fact that there are steady, year-in-, year-out efficiency gains, but not the sharp acceleration embedded in all peak oil demand forecasts. While EV versus ICE sales are hotly debated, the efficiency gain argument has been under the radar and ignored by most. Many observers take as a given government mandates for things like improved fuel economy. Our analysis has long shown that such efficiency gain promises are typically missed by 65%-95% (i.e., relative to whatever was mandated by the government). We would like to publicly give OPEC Research credit for being the only major forecasting body we have seen to highlight this point besides us.
Exhibit 7:Efficiency gains steady not accelerating
Source: OPEC.
⚡️On A Personal Note: Mid-Season Golf Update: A Slow Start But Thank Goodness for President’s Cup
It has been a slow start to my 2025 golf season. Year-to-date rounds played are down 30% and practice time 25% lower versus the same period last year. The combination of a rainy three month stretch in the greater New York City region—we have rain and thunderstorms literally every day here—and helping my parents with their transition has driven the negative variance. But things are picking up! Nothing like 5 rounds in 8 days in St Andrews over the July 4th holiday and university graduation week to try to get back on track.
By way of background, I took up golf in 2014 at age 45 and retirement from Goldman Sachs. Relative to a 27 GHIN (handicap index) at the end of the 2014 season (mid-November for my area), I was able to improve each and every year to a low of 7.9 at the end of 2022—the last full year before un-retiring to Veriten in March 2023 (Exhibit). I am currently a 9.6 and have generally been a 10-10.5 over my two Veriten partner years. The difference between retirement and working golf is primarily practice time. Previously playing 100-120 rounds per year was fine, but it was the short game and putting practice on most non-playing days that drove the improvement to high-single digit. I cannot and do not blame Maynard for the GHIN backup. I have to take responsibility for my actions—working full-time has cost me 2 GHIN points.
Exhibit OAPN: GHIN Handicap Index
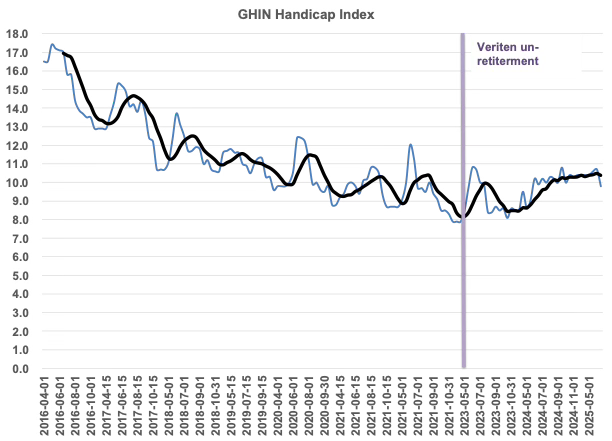
Source: MGA, Super-Spiked.
While nothing beats playing in the Home of Golf, my local highlight this year has been my long-time golf partner Tom and I reaching the Final 4 in our club’s season long President’s Cup tournament. We qualified in early May shooting a net -2, with each of us hitting putts on 17 and 18 that just kept us under the -1 cut line; we were the 28th of 32 teams to qualify. The highlight of my 2025 golf season thus far was our Round of 32 match, which was against a team of (super nice) 5 and 6 GHIN golfers, one of whom does read Super-Spiked on occasion (kind of hoping he skips this one); Tom was a 14 at the time and I was 10.5.
After 12 holes of match play, we were down by 4 with only 6 to go. For all practical purposes, the match was over. The 5 GHIN guy was a gross 2 under after 12 and single-handedly smoking Tom and I. We knew we had strokes coming to us on 16, 17, and 18 and vowed to make it at least to 16 to save some face. On 13, after a solid tee shot, Tom put his approach 4 feet from the hole and made birdie to bring us to 3 down. On the long par 3 on 14 (~200 yards), I was the only one to hit the green and made par to bring us to 2 down. We blew a chance to cut the lead to 1 on 15, but, with strokes, took 16 and 17 to tie it up! From 4 down with 6 to play, we were suddenly even just 5 holes later and 1 to play. There was little chance we would survive a sudden playoff against inherently better players and were fortunate to close it out on 18. To be sure, we used all of our allowed strokes to beat otherwise better players. But that is the beauty of the handicap system in golf; anyone can have a competitive match with anyone else, net of strokes.
We overcame some old-person gamesmanship (some would say bullying) in our Round of 16 match to pull it out after a thunderstorm delay caused the last five holes to be played the following morning. In this match, we were the better players but were tied after 13 and the thunderstorm-driven halt in play. Tom and I gave each other a pep talk that we both needed to be mentally tougher and not fall for all the old person tricks of the trade. We demolished them the next morning. Tom won 14. I won 15. They won 16 and I won it on 17. And yes, the head pro was called out for a rules determination on 17 (they were correct in this case). That’s the kind of match it was. But we won!
Our Round of 8 match was played this past week in soaring heat. I overcame significant leg cramping just after the turn with a recovery par on 10 for the win, an up and down win on 11, a great up and down tie on 12, and a chip-in birdie for the win on 14. Some good wedge play and solid putting by me despite reduced practice time. Tom closed out the victory on 16 with a clutch 2 putt from just off the green
In country club match-play net of handicap tournaments, it is never over until it’s over. And perhaps all is not lost on the 2025 golf season. We still have the rest of summer and Fall golf to come and our Final 4 Presidents Cup match.
⚖️ Disclaimer
I certify that these are my personal, strongly held views at the time of this post. My views are my own and not attributable to any affiliation, past or present. This is not an investment newsletter and there is no financial advice explicitly or implicitly provided here. My views can and will change in the future as warranted by updated analyses and developments. Some of my comments are made in jest for entertainment purposes; I sincerely mean no offense to anyone that takes issue.
Great piece, Arjun. It’s great to see all this comparative data compiled in one place. It’s an essay to bookmark for future reference, for sure!
I’m surprised that the smart analysts ignore the reality of poor countries climbing the economic ladder. It is inevitable unless the rich countries structure society in a way that intentionally keeps them down. That type of Malthusian belief system does seem to exist with some, but I don’t think it’s mainstream enough to be a baseline model.
So if the poor countries are going to become economically more wealthy, they MUST have energy. And to go from poor to richer they need the most affordable and dispatchable energy. I agree nukes and “renewables” will grow in the developed world, but they can’t be the starting point for a country trying to climb the economic ladder. They’re simply too resource and capital intensive for a poor country to start with. There is a reason they’re only now being considered in the rich countries. They’re a luxury energy source. They’re a first class airline ticket when the rest of the world is riding used bicycles.
As you note, the onus is on the oil demand deniers to tell us what level of World Economic Growth is possible under a Net Zero scenario dominated by intermittent electricity sources- with all the transmission losses fully factored in, and the replacement costs we will be facing in a few years’ time- which will also be compounding nicely.