Oil Super-Cycles Are About Upward Pressure on Long-Dated Oil, Not Near-Term Inventory Movements
Navigating The Energy Crisis Era
James Carville, chief political strategist for Governor Bill Clinton during his successful 1992 presidential run, coined the phrase "It's the economy, stupid," a reference that weak US economic conditions under President George H.W. Bush should matter more than his foreign policy successes including winning the Gulf War. Why didn't incumbent President Bush run away with re-election after the overwhelming Gulf War victory? James Carville had the answer.
Later that decade, Schroeder Wertheim's European oils analyst team led by Anthony Ling applied James Carville's logic to oil markets with their "It's the oil price, stupid" report series. We became Goldman Sachs colleagues in 1999 with the phrasing morphed to "Stupid Oil Price," as we messaged the importance of returns on capital to go along with oil price movements.
An updated version of this phrasing might be "It's the long-dated oil price, stupid" that matters most for whether or not an oil super-cycle is emerging. Too many oil market observers remain transfixed with inventory movements, something we observed 20 years ago during the Super-Spike era and persists to this day. If inventories do draw in 2H2023 as many are expecting, it is quite likely strengthening backwardation would drive a rally in spot oil. The question we are trying to address in this post is understanding what will drive back-end oil and a potential longer-term super-cycle.
We would observe that the 2002-2014 Super-Spike era regularly moved between contango and backwardation (i.e., inventory builds and draws). In fact, there were notable stretches from 2004-2007 where oil bears were regularly citing inventory builds (and contango) as a sign that it was speculators driving oil markets higher. The bears were wrong.
Our work back then focused on the fact that sharply rising CAPEX was not yielding near-term supply growth and was instead driving break-evens higher. In other words, a higher oil price was needed to achieve minimally acceptable returns on capital. At the same time, global oil demand marched higher along with higher prices, in sharp contrast to consensus wisdom. The net of it all was that the 2002-2014 super-cycle was driven by a sustained rally in long-dated oil. It was my former partner and colleague Jeff Currie that coined the phrase "long-term shortage drives near-term surpluses." It is really the best descriptor to understanding oil markets and the information that can be gleaned from the forward curve. In other words, concern about structural supply/demand tightness was both driving the back-end higher and leading to short-term inventory builds as oil consumers stored oil in anticipation of future tightness.
In the current environment, we suspect it would take a combination of persistent positive demand surprises coupled with evidence that US shale supply was experiencing diminishing responsiveness to a higher rig count to drive long-dated oil prices higher. Some of you might be mumbling, aren't you saying inventories will draw if it's positive demand versus disappointing supply? Not necessarily. A higher price would likely knock demand back down to available supply, given above-ground inventories and OPEC spare capacity are otherwise limited, in our view. A rise in long-dated oil would be the signal to the oil industry that new greenfield projects and higher exploration are needed and that there was diminishing confidence in US shale growth. And it's Jeff Currie's line for why we may not actually get oil inventory draws if a super-cycle in fact develops.
Understanding information to be gleaned from the forward oil curve
Key points:
Inventory draws/builds drive backwardation/contango at the front end of the curve. Such movements can often help explain short-term oil price movements, but do not speak to the longer-term cycle (Exhibit 1).
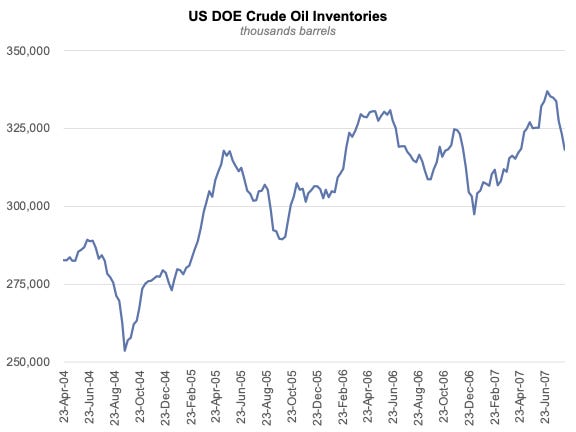
It was the rise in long-dated oil in the Super-Spike era of 2002-2004 that was key to that era's super-cycle. In fact, short-term inventories built, confounding oil bears most of the way up (Exhibit 2-3).
The structural oil cycle is all about long-dated oil; relative to 2Q2022 highs, both short- and long-dated oil have pulled back though the decline has been far more muted at the long end of the curve (Exhibit 4).
During the 2002-2014 Super-Spike era, long-dated oil rose due to:
Oil demand surprising to the upside along with higher oil prices, following China's 2002 World Trade Organization (WTO) entry and the emerging market boom that followed;
Non-OPEC supply consistently disappointed as the easy debottlenecking and near field exploitation following the 1970s CAPEX boom became insufficient to sustain or grow production; and
It became apparent that most OPEC countries were over-stating immediately deliverable production capabilities.
Today, the situation looks different than 2002-2014:
Oil demand is expected to experience moderate growth in the coming decade, much better than the peak/plateau expectations that some are calling for, but still a far cry from the emerging market-driven boom we saw in the 2000s.
Maturing shale resource has yet to manifest in disappointing US production volumes relative to rig count, a key item to watch in coming quarters and years.
The lack of a major CAPEX boom, thus far, is limiting cost inflation, which ironically has likely helped to keep a lid on long-dated oil.
Recent better-than-expected production from US- sanctioned countries Russia, Iran, and Venezuela is a reminder that geopolitical risk can cut both ways.
The middle two points are worth expanding on as they go somewhat hand-in-hand. In an environment of moderate oil demand growth, which we will define as around 1 mn b/d of annual growth, is it possible that oil markets can balance via a combination of the Permian + Canada + Brazil + Guyana + OPEC creep + net zero oil supply growth from the entire Rest of the World? Said another way, greater evidence that we are at or near peak Permian supply coupled with faster declines in the Rest of the World excluding Canada, Brazil, and Guyana would likely be needed to drive long-dated oil higher.
Exhibit 1: Inventory movements drive the front end of the oil curve
Source: Bloomberg, DOE
Exhibit 2: Oil inventories actually rose for decent portions of the 2004-2007 start of the Super-Spike era
Source: DOE
Exhibit 3: The forward curve was regularly in contango during the Super-Spike rally, as the sharp upward move was driven by long-dated oil prices
Source: Bloomberg
Exhibit 4: Long-dated oil is basically back toward the higher end of its pre-2020 trading...it has yet to show signs of wanting to break meaningfully to the upside
Source: Bloomberg
Long-date oil curve drivers: 1990s lackluster vs 2000s super-cycle
At its core a rise in long-dated oil prices is driven by the need to stimulate a combination of a (1) a structural slowdown in trend oil demand growth; and (2) a structural increase in global oil supply growth. Let's use some examples to explain.
When supply growth is sufficient to meet demand growth within a given oil price range, there would of course not be a reason for the long-term range to change, with inventory movements driving short-term price volatility around long-dated oil. In the 1990s, oil prices traded between $15-$25/bbl as global oil demand was met by reductions in OPEC spare capacity built up in the 1980s (Exhibit 5). In addition, non-OPEC supply grew as exploitation/debottlenecking projects that were similarly an outgrowth of the 1970s super-cycle existed to add supply at moderate costs.
The 2002-2014 super-cycle was driven by the recognition that the easy supply growth era had passed. OPEC spare capacity was effectively eliminated, and the non-OPEC cost curve was steepening and inflating as evidence mounted that industry needed to shift to greenfield from brownfield.
Exhibit 5: Long-dated oil was around $20/bbl for a large portion of the 1990s...it was the march higher in the 2000s that coincided with that era’s super-cycle
Source: Goldman Sachs
Where are we today?
We currently see mixed signals on both upward demand pressures and where we are in US shale maturity. While OPEC spare capacity we believe remains limited, production creep (without spare capacity build) is possible.
DEMAND
We suggest a framework that looks at three scenarios:
"Peak demand": Oil demand growth slows to a flat-to-downward sloping trajectory in coming years due to a to-be-determined mixture of worsening energy poverty (bad) or a step change improvement in efficiency gains and new product substitution (good).
"Grind-it-out". Ongoing moderate growth of 0.75-1 mn b/d per year, as global GDP growth struggles.
"Rapid energy poverty reduction": Oil demand grows over 1.5 mn b/d per year driven by improved living standards for the other seven billion people that do not live in the United States, Western Europe, Canada, Japan, or Australia.
Our base-case oil demand outlook is closest to a grind-it-out-scenario. We hope to be proven wrong in favor of a rapid energy poverty reduction scenario leading to sharp increases in oil usage in regions like Africa, India, southeast Asia, and eastern Europe. The worse-case outcome is worsening energy poverty, a failure to achieve step change improvements in efficiency, and a recognition that demand substitution is easier said than done.
SUPPLY
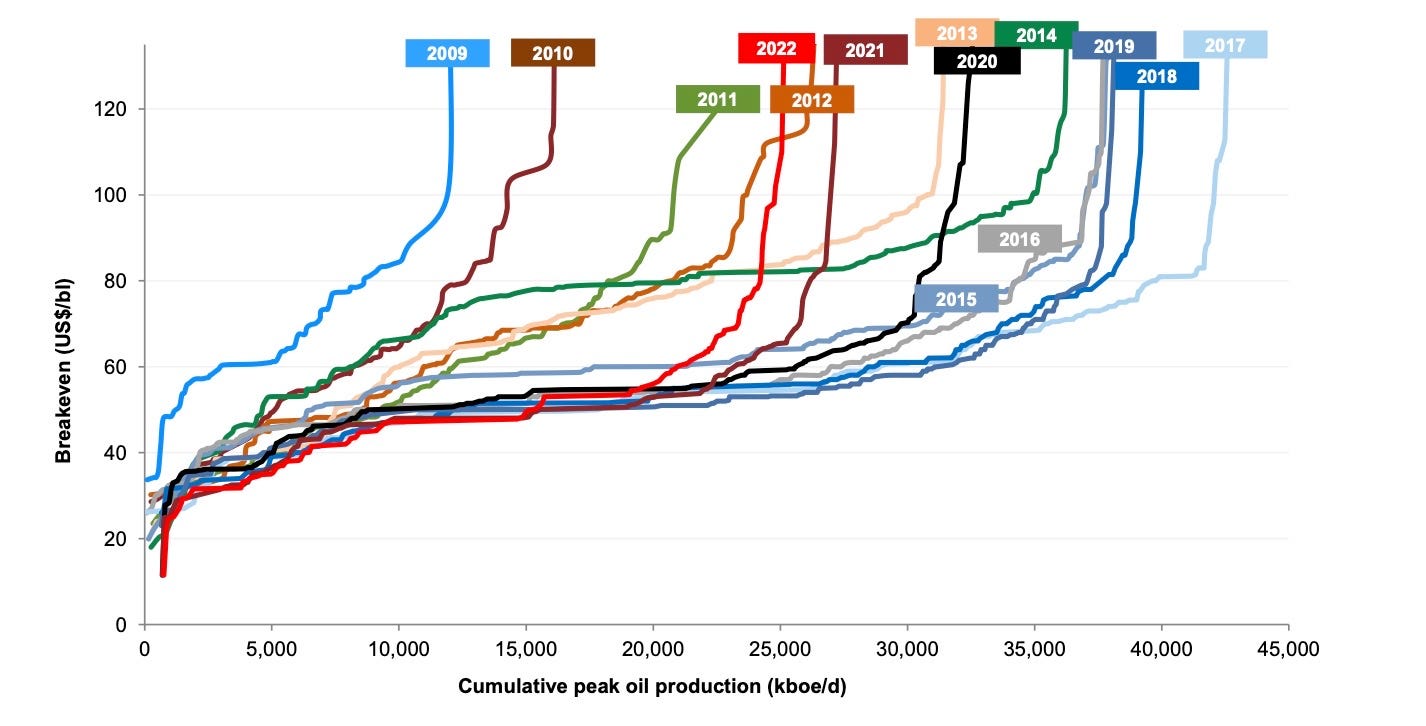
From its flattest point in 2017, the oil curve has begun to re-steepen, signifying a maturing of the legacy resource base (Exhibit 6). Invariably, we would fully expect highly developed regions, such as the basins that contain US shale plays, to reach a mature plateau and eventually decline. The application of new technology can eventually lower the cost of developing inventory that today is considered to be Tier 2 or Tier 3. But the successful application of technology and resulting cost reductions do not always happen in a linear fashion.
Exhibit 6: The oil cost curve has been steepening in recent years, a sign that a new CAPEX cycle will at some point be required in the event of ongoing global oil demand growth
Source: Goldman Sachs
The 2000s super cycle was ultimately bad for structural ROCE: Would grind-it-out be better?
The short answer is that ROCE sustainability is as much about company-specific strategy execution as it is about the broader macro backdrop. The goal is always to generate competitive through-cycle profitability irrespective of the macro. From a cyclical standpoint, it is to earn at least an 8%-10% "cost-of-capital" return at a normal industry trough and at least break-even in a deep trough like we saw with COVID or at the depths of the Great Financial Crisis.
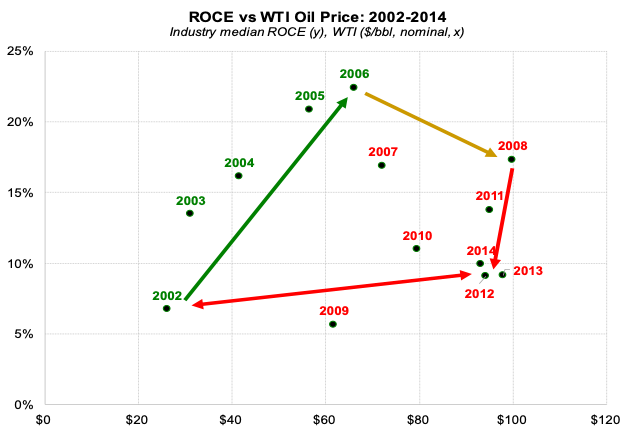
As we articulated in our ROCE Deep Dive series from early 2022 and have reiterated in numerous subsequent posts and videopods, the oil price super-cycle was ultimately disastrous for sector profitability, a point best articulated via the "Quadrilateral of Death", the net of which was that a quintupling in oil prices ($20/bbl to $100/bbl) resulted in essentially no change to profitability and cost of capital returns at best (Exhibit 7). Then the bottom fell out in late 2014 and profitability collapsed to well below cost of capital for the subsequent five years. There is nothing about that history that any company should want to repeat.
In many respects, the current environment may prove to be a profitability sweet spot. The absence of an obvious super-cycle coupled with a "Super Vol" macro backdrop and "energy transition" narrative is keeping CAPEX at bay. Just about all companies are instead focused on capital return strategies rather than CAPEX growth.
Exhibit 7: Avoiding the “Quadrilateral of Death,” which we have discussed in prior posts, should be a key objective of individual companies and the sector broadly
Source: S&P CapitalIQ, Super-Spiked
⚡️On a Personal Note: Berry Henson
Our local club hosts U.S. Open (golf) qualifying matches. An Asia Tour player originally from southern California, Berry Henson, asked for a local caddie to help him navigate the 36-hole event. On the tee box on the first hole of our South Course, Berry drew his drive into the stream that runs down the left side of the hole. After a penalty drop, his approach shot landed in the water, just short of the green. He's now lying four on what plays as a par 4 for the pros (a 450-480 yard par 5 for the rest of us). After one hole he is two over par. He could have packed it in as not his day.
Instead, Berry went 8 under over the remaining 17 holes on South and 1 under on the final 18 on the North Course to earn 2nd place with a 7 under finish. Berry Henson qualified for the U.S. Open (top 3 winners make it) that is being played this weekend at L.A. Country Club! Berry is 43 years old and had never before qualified for a major. During COVID lockdowns, he drove for Uber to supplement his golf earnings.
The local caddie that was on Berry's bag that day was my son, who noted Berry never lost his cool, stayed positive despite a number of lip-outs and other missed opportunities, and was the most mentally tough golfer he had ever witnessed. You can dismiss the last comment as a 19-year-old's opinion of mental toughness, but I think his assessment is spot on. Berry insisted that my son not tell him his score or where he was on the leaderboard. His only goal was that the next shot would be a good one: a good motto to live by.
The kid is now in L.A. as Berry's guest with an instructor’s pass to the event. Berry will have his normal Asia Tour caddie on his bag this weekend. Despite being in the biggest tournament of his life, in his home region, only a few months after his mother passed away, surrounded by family, friends, and the numerous high and low profile fellow professional golfers he is friends with, he stayed in touch with my son over the past week to ensure his travel out west went well and he was able to access his instructor’s pass.
Berry Henson is now my favorite professional golfer, a good person, and someone living his dream.
UPDATE: Berry finished Friday play at +10 and is likely to miss the cut, which is projected at +2 at the time of finalizing this post. Congratulations to Berry for playing in his first Major, and we look forward to seeing him in future tournaments.
Exhibit 8: Berry Henson preparing for his final approach shot on Hole 36 of his US Open qualifying match
Source: Super-Spiked
⚖️ Disclaimer
I certify that these are my personal, strongly held views at the time of this post. My views are my own and not attributable to any affiliation, past or present. This is not an investment newsletter and there is no financial advice explicitly or implicitly provided here. My views can and will change in the future as warranted by updated analyses and developments. Some of my comments are made in jest for entertainment purposes; I sincerely mean no offense to anyone that takes issue.


Thanks Arjun for another great post! I heard your former partner Jeff Currie interviewed last week and he seems optimistic that prices will come up in the back half of this year. OTOH, I heard Michael Kao in a podcast and he seems a lot less optimistic than he was a year ago and has changed his forecast from having what he was calling an oil "singularity" in 2024, out to maybe 2026 or perhaps never if we have something similar to the grind-it-out scenario that you describe in this post. I think Kao's main concern has been that there is insufficient long term CapEx, which I believe Jeff Currie shares. Also what about CapEx in refining? I saw a story on the EPA enforcement action against Suncor at their Commerce City refinery in Colorado and the author of that piece was blaming some activist hedge fund for forcing Suncor to return more capital to shareholders instead of making the necessary repairs to their refinery (which is the typical spin you see in news stories about oil companies). But I was wondering whether we need more CapEx in refining or not?
Always a pleasure to read your Saturday posts. Thank you for telling the Barry story and how cool that your son was involved in Barry’s qualifying. Could you break 80 at the LACC?