In this week’s post we assess near-term “peak oil demand” signposts, none of which support the idea that a peak is imminent by or around 2030. Three points:
“Efficiency gains” are well below levels required to stabilize oil demand at a normal global GDP growth rate let alone drive a decline.
The onset of an “EV Recession” is revealing the absurdity of applying uniform, aggressive EV adoption “s-curves” to all regions as a base-case forecast.
OECD demand, which we agree is mature and we had thought could decline, is actually showing greater stability in 2024 than originally expected.
It remains our view that there is not a decade let alone year that anyone can today know when oil demand will peak or even plateau. The unmet energy needs of the other 7 (soon to be 9) billion people on Earth are massive and it is not even remotely clear how their inevitable moving up an economic and hence energy s-curve will be met without using significant quantities of crude oil, natural gas, and, for that matter, coal (see previous posts here, here, and here). For countries that are not blessed with abundant crude oil or natural gas resources, we believe there will be significant motivation to find viable alternative technologies and energy sources. Of course, many of those same areas also have significant coal resources that are on-track to be used to meet energy needs. Never mind oil, global coal demand shows zero signs of approaching a peak! The implications of those trade-offs and how the world might think about motivating emerging market coal avoidance are for a different post.
As a reminder, the Lucky 1 Billion of Us use around 13 barrels of oil per person per year. The other 7 billion people on Earth use just 3 barrels. Our definition of social justice is that everyone is someday similarly rich—thanks to a mix of capitalism, markets, innovation, and limited government—which we believe would correspond to everyone on Earth using around 10 barrels of oil person per year. This would equate to a total addressable market (TAM) for crude oil on the order of 250 million b/d, well above 2023 oil demand of 103 million b/d.
To be clear, we do not believe there is a date—not even 100 years from now—when we will reach a 250 million b/d oil market, as we expect alternatives to crude oil to be developed well before such a figure is achieved. The debate is really where between 103 and 250 million b/d does global oil demand peak or plateau. Given the significant inherent uncertainty in the timing of when new technologies will economically scale, we see little value to us hazarding a guess on a specific peak oil demand number or year. We are confident that there is little chance oil demand will permanently peak or plateau over the next ten years—Veriten’s core analytical time horizon—and project 2035 oil demand will be on the order of 115 million b/d. Based on what we know today, we expect oil demand to continue to rise for at least an additional decade to 2045.
“Efficiency gains” show no evidence of an imminent peak in oil demand
At the most basic level, one can think of oil demand as a function of global GDP multiplied by the barrels of oil demand to generate a $ of GDP (Exhibit 1). “Efficiency gains” is the concept that it takes fewer barrels each year to generate a $ of GDP. Said another way, the multiplier of GDP to oil demand improves every year. Efficiency gains in this sense incorporate both product substitution (e.g., electric vehicles (EVs), renewable diesel, sustainable aviation fuel (SAF), etc.) along with fuel economy (i.e., improvements in miles per gallon or kilometers per liter) and other productivity gains.
Exhibit 1: Oil demand derivation
Source: Goldman Sachs Research, IEA, Our World In Data, Veriten.
How do I read the graph?
The green bars graph the growth rate in global GDP. The light red bars represent the change in the number of barrels of oil demand to generate a $ of GDP. The black line is the annual growth rate in global oil demand.
The dotted purple line is the rolling 5-year average for efficiency gains, which smooths year-to-year volatility.
If global GDP grows 2.7% in a given year, in order for oil demand to be flat, the efficiency gain would have to be -2.6%, which is the red dotted line.
In order for oil demand to decline 1% per year at 2.7% global GDP, efficiency gains would need to be -3.6%, which is the red dashed line.
What are the key takeaways?
The only time we have been near a -2.6% efficiency gain is when global GDP was growing at 4% or more.
The only time oil demand has dropped in a specific year is when GDP has declined due to recession or COVID.
There is no evidence in 2022 or 2023 that we are moving anywhere near peak or plateau oil demand. If anything, we are further away, though clearly the COVID recovery post 2020 is impacting the notion of efficiency gain.
2024 should be our first clean year for global GDP and efficiency gain post the recovery from COVID lows. We project +1.5% oil demand growth in 2024, which reflects a -1.2% efficiency gain in 2024, significantly less than the -2.6% “flat oil demand” line though more than what was seen in 2022 and 2023, and global GDP of 2.7% (GS estimate).
If you look at the rolling 5-year average efficiency gain, you can see that it went from around 1% in the 1990s to around 2% since. Oil prices rose 5X in the 2000s and have been 2.5X-4X the 1990s level since then. Will it take another 3X-5X move in oil prices to really motivate peak or plateau oil demand?
“EV Recession” and lowered growth ambitions
Adam Jonas, Morgan Stanley’s high-profile autos equity research analyst, dubbed the global EV slowdown as “The EV Recession” in an April 17, 2024 research report. We have previously written about the EV S-Curve Rorschach Test (here), which highlighted conflicting bearish and bullish datapoints but stopped well short of declaring an EV recession. Perhaps we were uncharacteristically too timid and credit Mr. Jonas for his more directly titled report.
Since the EV slowdown is pretty well known at this time, we will get straight to our takeaways and conclusions:
There is not a singular EV s-curve that should be applied to all regions. For example, the relatively fast ramp in Norway we believe will not be repeated in the United States or India.
In Norway and China, the two countries that have had the most success significantly ramping EV sales due to government policy, overall oil demand is still growing; resilience in Norway’s overall oil demand we find especially surprising.
EVs have some attributes that are favorable relative to internal combustion engine (ICE) vehicles and some characteristics that are unfavorable. The “landline to cell phone” analogy we believe is being grossly misapplied by EV bulls.
At least some portion of the hype around EV adoption rates we believe was driven by Tesla becoming a “Magnificent 7” stock market darling. With Tesla shares now in structural decline, consistent with greater pragmatism setting in about the likely ramp in EVs overall, we believe the trend of legacy auto manufacturers scaling back EV growth aspirations has only just begun.
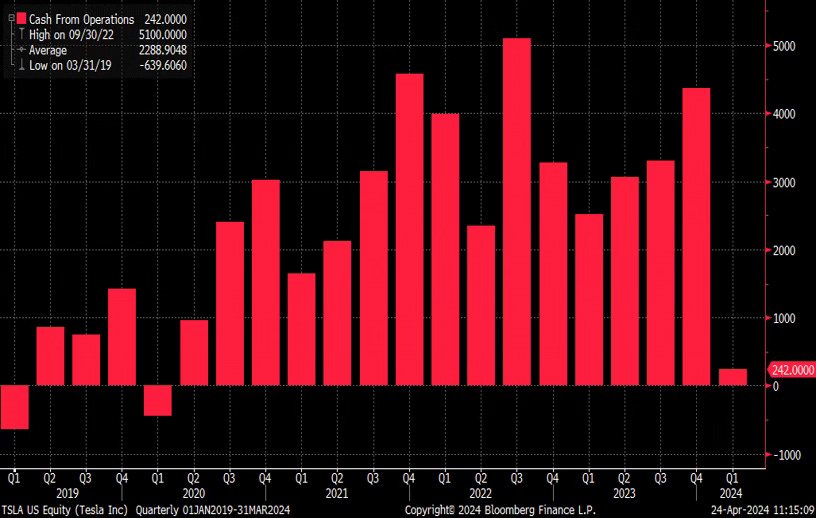
In 1Q2024, Tesla generated its lowest quarterly cash flow from operations since 1Q2020, the start of COVID lockdowns (Exhibit 2). Tesla is by far the most successful and most profitable EV manufacturer. What does its challenging results portend for legacy auto companies that are spending billions of dollars on new EV lines?
Exhibit 2: Tesla quarterly cash flow from operations
Source: Bloomberg.
To be clear on our outlook for EVs, it is the slope of the growth rate that we are pushing back on, not the idea that absolute sales volumes will rise and ultimately account for a meaningful portion of future vehicle sales. As we have highlighted with China, if a country does not have abundant crude oil resources, it will be motivated to have a coal-fired EV over an OPEC+ or US shale-fired ICE vehicle. We think of EVs as being an important contributing factor to keep oil demand from ever reaching its 250 million b/d TAM. But that is a very different perspective than viewing EV growth as leading to displacement of the current 103 million b/d of demand, i.e., so-called peak oil demand.
If you want to have some fun following Tesla and EVs, there is no place like Twitter-X. Our suggestion is to use the Lists function to create an EV or Tesla category. Below are our favorite follows:
Tesla bears: @BradMunchen, @GordonJohnson19, @montana_skeptic, @StanphylCap
Tesla bulls: @WholeMarsBlog, @garyblack00, @ICannot_Enough, @HyperChangeTV (on YouTube)
Tesla data/stats: @TroyTeslike
OECD demand not declining as sharply in 2024 as was originally forecast
A given for the peak oil demand argument is OECD oil demand declines. Frankly, this is a point we have not disputed given the mature nature of OECD oil demand. Our focus has been on the significant unmet energy needs of the other 7 billion people on Earth more than offsetting our expectation for modest erosion in the rich, developed world. That said, even our outlook for the OECD has been too pessimistic.
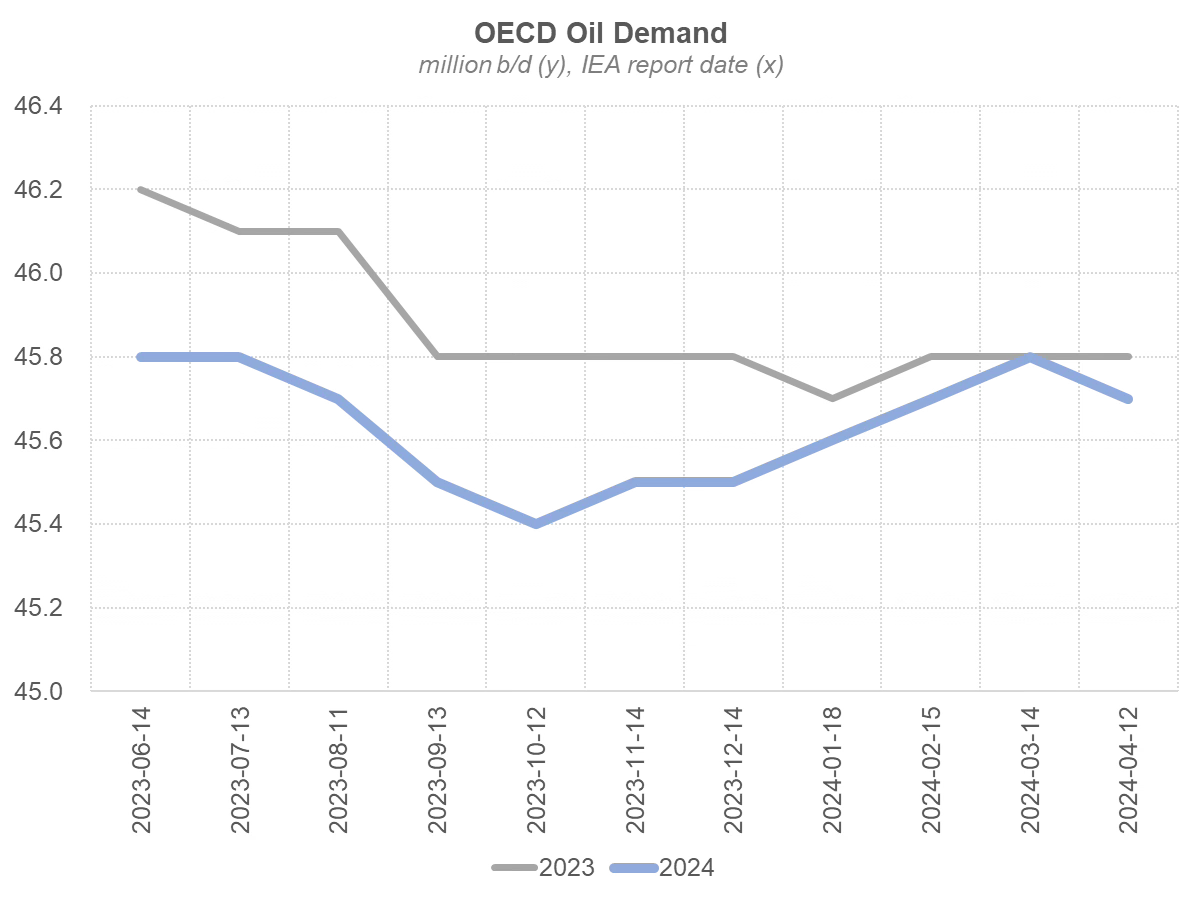
While it is still early in the year, the progression in 2024 OECD oil demand has generally been meaningfully stronger than we or others like the IEA had anticipated. OECD demand is now expected to be essentially flat in 2024 vs 2023 versus a 0.4 mn b/d decline expected when the IEA first came out with a 2024 forecast in June 2023 (Exhibit 3). We would also observe that no one believes we are in economic boom times in the OECD, yet oil demand is broadly flat. The overall evidence points to OECD demand being on a long-term plateau but having not yet entered terminal decline.
Exhibit 3: OECD oil demand: 2024 versus 2023
Source: IEA, Veriten.
IEA OMR vs OPEC MOMR
The International Energy Agency (IEA) has long been considered the gold standard in oil markets for providing historic oil supply/demand data and for setting the tone on the outlook for the current and next year via its closely watched monthly Oil Market Report (OMR). IEA forecasts have long faced scrutiny, at times withering, from market participants and politicians for the inevitable variances to demand and supply that arise. We would argue that the (never-ending) criticism it receives is a testament to its ongoing importance and stature within oil markets. Whether you love, hate, or are indifferent to the IEA, the organization is clearly highly relevant to understanding oil markets.
The two other agencies that provide market-relevant oil supply/demand analysis and forecasts are OPEC’s research group via its Monthly Oil Market Report (MOMR) and the U.S. Energy Information Agency (EIA) via its Short-Term Energy Outlook (STEO). Historically neither OPEC nor the EIA have been tone setters on par with the IEA, though oil specialists have generally followed all three. Since the IEA’s May 2021 publication of its infamous Net Zero by 2050 report, OPEC research has taken a higher profile role via its own monthly outlook as well as other public communications responding to statements or editorials made by the IEA’s leader Fatih Birol.
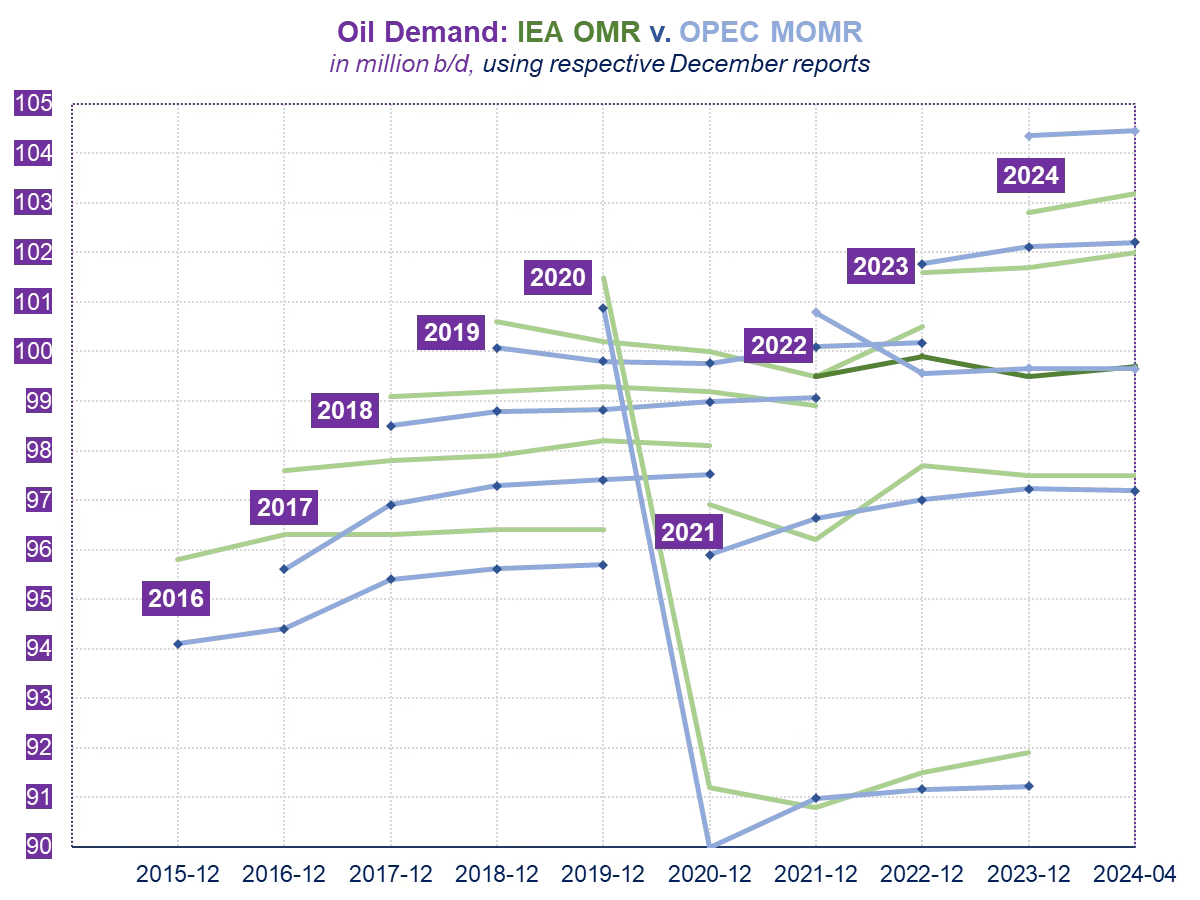
For 2024, OPEC research has a meaningfully higher outlook for global oil demand than does the IEA (Exhibit 4). Given that at least some oil market participants are starting to wonder the degree to which “climate ideology” is seeping into the OMR, we thought it would be a useful exercise to track the historic track record.
Exhibit 4: IEA OMR vs OPEC MOMR
Source: IEA, OPEC, Veriten.
How do I read the graph?
The green lines are for the IEA’s OMR and blue lines are for OPEC’s MOMR. The x-axis represents the respective publication dates for the OMR and MOMR. The y-axis is global oil demand.
For a given year, say 2016 (marked with the purple box), we start with what the IEA and OPEC forecasted in their respective monthly reports in December 2015, i.e., at the start of the given year; we then track future updates/revisions to the initial estimate over the next 4 years.
For example, the IEA’s estimate for 2016 demand started at 95.8 million b/d in its December 2015 OMR and ultimately rose to 96.4 million b/d with its December 2019 report.
Has the IEA’s MOMR or OPEC’s MOMR historically been more accurate?
The average revision excluding 2020 for a given year’s demand tracked over a 4-year period (i.e., to incorporate subsequent revisions) has been +0.3 million b/d for the IEA versus +1.1 million b/d for OPEC Research. Objectively, the IEA’s estimates have proven to have been closer to the final mark over the period analyzed.
2024 is a big test for OPEC Research which started the year with by far the highest demand forecast of any public or private (i.e., including bank and consulting firms) forecaster.
What other observations do we have?
Prior to 2022, the IEA started each year MORE optimistic on demand than OPEC Research.
It is not clear the degree to which the IEA’s Net Zero by 2050 report and the public advocacy for an accelerated energy transition has impacted the OMR group; we suspect it has had less of an impact that is generally perceived, but not zero.
We would note that in 2022, the first year after Net Zero by 2050, the IEA was below OPEC Research at the start of the year, though this could well be driven by the significant uncertainty that many have felt in forecasting oil demand post COVID. And so far the IEA has had the better 2022 forecast based on subsequent revisions.
For 2023 oil demand, it is still too early in the revision cycle and the beginning of year estimates are close; both groups have since revised upward initial estimates by similar amounts.
It is now common for at least some, if not quite a few, market observers to dismiss all IEA estimates as de facto climate advocacy. We would simply observe that the IEA has the better historic track record on demand, though it bears watching what can be gleaned from how 2023, 2024, and future years play out.
Where could we be wrong or what policies or innovations could bend the oil demand curve?
New technologies, innovation. We recognize that trillions of dollars are being invested in a broad range of new energies technologies in an effort to crack the code on scalable alternatives to traditional energy sources. We take the spending seriously and devote considerable time at Veriten and with our other affiliations to evaluating new technologies. Someday, something will work.
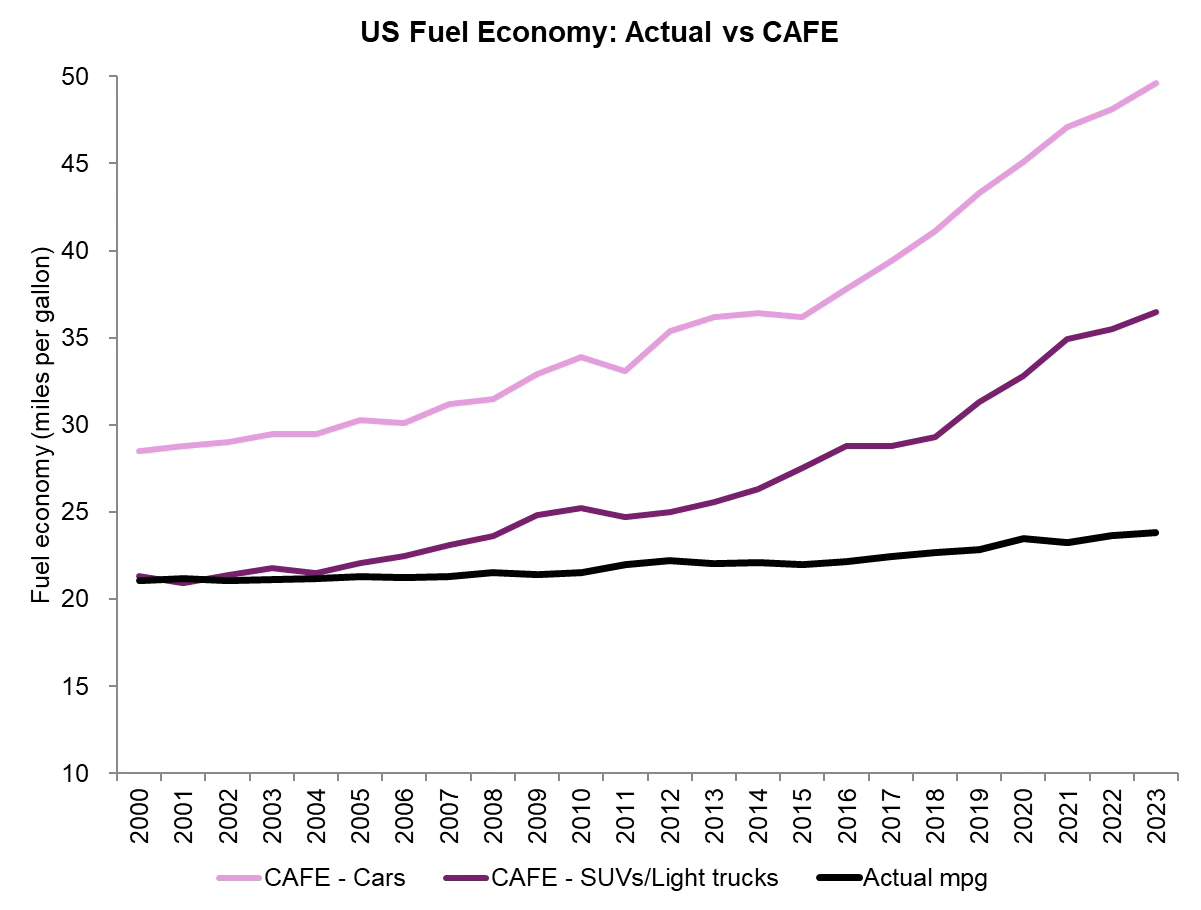
SUV ban>ICE ban. We recognize that there is no realistic chance an SUV ban is going to be happening anywhere any time soon. In lieu of an outright SUV ban, how about no longer allowing more lax fuel economy standards for SUVs? Exhibit 5 shows the sharp divergence over the past 20 years in actual fuel economy gains in the United States, which average +0.6% of improvement per year versus much higher mandated increases in corporate average fuel economy (CAFE) standards. We attribute the major miss in fuel economy gains to be driven by increasing vehicle weight (i.e., the SUV-ification effect).
Bearish EV news has at least been partially offset by accelerating growth in hybrid vehicle sales in the United States. In our view, ICE vehicle bans in states like California are destined to fail and will be delayed if not cancelled outright. However, a significant ramp in hybrid vehicle sales could help move the needle on fuel economy gains. We have highlighted many times previously that fuel economy improvement is always high on the list of what bearish oil market analysts most mis-model, with increasing vehicle weight the culprit. Still, if there is a desire to bend the curve on oil demand, this would be a place to start.
Exhibit 5: Actual fuel economy has remained well below CAFE as vehicle weights have increased
Source: DOT, EIA, Veriten.
Low-cost Chinese EV imports. It is an open question as to whether the US or Europe will allow significant (or any?) imports of inexpensive Chinese EVs from the likes of BYD. On A recent Close Of Business Tuesday podcast (here), David Sacks, a China expert with the Council on Foreign Relations, expressed doubt that we would see BYD imports in the United States, though he also noted that he is not an EV markets expert.
Oil prices increase 5X+. As discussed above, a sizable increase in oil prices is typically a pre-requisite to muting oil demand.
Socialism makes a comeback. LOL. Do high school and college students study the abysmal failure of countries that have pursued socialism?
⚡️On A Personal Note: Spring golf!
It’s Spring and in the US northeast that means golf season is back! Our 2023 goal was to play an average of 2 rounds per week over the 30-week primary playing months (early April through mid-November) plus another 5-10 rounds during the offseason for a total of 65-70. We got in 80 rounds last year, or about 1 round every 4.5 days!
While the number of rounds did not suffer too much from un-retirement (100-120 per year was the retirement norm), practice time was way down in 2023 at a paltry 20 hours during the core golf season versus a historic average 2X-3X that figure. And it showed up in the fact that my handicap index did not drop for the first time since taking up golf post Goldman in 2014.
For 2024, we will stick with the same goal of 65-70 rounds for the calendar year. The upside of un-retiring to a firm based in Houston is it has the potential to be a golf season extender if utilized properly. Our last baby goes to college in the fall, which doesn’t necessarily impact the number of golf days, but should allow for more destination golf and more time in the great state of Texas.
In terms of other goals, my only golf objective this year is to have fun. I know that is super lame. But I do not have any goals at this moment about lowering my handicap, winning tournaments at our club, making the “A” flight, etc. Frankly, I would be thrilled to maintain the 8-10 GHIN range I’ve been in since 2H2022.
If my handicap does go lower, the strokes will be found in the short game. Surely it cannot be that hard to commit to just 1.5 hours per week of short-game practice over 30 weeks? Maybe there is a stroke or two I could shave off? OK. I am going to commit to at least 40 hours of short-game practice time between now and the Fall. Zoom and Teams calls are totally doable from a putting green or bunker. I will keep my video off.
⚖️ Disclaimer
I certify that these are my personal, strongly held views at the time of this post. My views are my own and not attributable to any affiliation, past or present. This is not an investment newsletter and there is no financial advice explicitly or implicitly provided here. My views can and will change in the future as warranted by updated analyses and developments. Some of my comments are made in jest for entertainment purposes; I sincerely mean no offense to anyone that takes issue.


Tell the WSJ this. In today’s story on XOM and CVX, they quote an “analyst” that is concerned about the “sunset nature” of the industry ….
I made this chart a week ago and the order might have changed since then. Anyway, Petrobras' ($PBR.A) 3-year total return, from April 16, 2021 to April 19, 2024, is higher than those of all embers of magnificent 7. During the same period, $XOM also beat every member but $NVDA.
https://pbs.twimg.com/media/GLjebKrbsAAgLWC?format=jpg&name=4096x4096